Introduction
Everyone loves this quote from Warren Buffet:
“Be greedy when others are fearful and fearful when others are greedy”
A lot of people try applying it to almost anything. And I’ve heard it applied in Australian property investment circles a lot.
It might work well in the share market, which is the context for which Buffet intended it. But the data suggests applying it to property investing is a clear mistake.
Fear, greed and a place to sleep
Investors make their decisions to buy or to sell purely for financial gain. It’s why the share market is often said to be driven by fear and greed.
But the majority of property owners in Australia are not investors. Most property owners simply want a roof over their head at night.
- Share market
- 100% of share owners are investors
- Entirely driven by financial gain
- Property market
- About 30% of property owners are investors
- Partially driven by financial gain
Financial gain may not be the big driver governing a decision to buy or to sell a property.
“Everyone who owns shares is an investor but not everyone who owns property is”
Therefore, the majority of the property market is driven simply by an essential need for accommodation. The property market is not so intimately linked to fear and greed as the share market is.
“Very few property owners in Australia sell their home to stop losses in a falling market”
So, although it might make sense to keep an eye on the emotions of the share market, perhaps it’s not that important in real estate.
How do we measure fear & greed?
We need some means of measuring fear and greed to know how to apply Buffet’s strategy.
“How do we know if the market is greedy or fearful?”
Perhaps a fearful investor is one who wants to sell.
Can we assess fear and greed as?
- Desire to sell is fear
- Desire to buy is greed
Perhaps the count of the number of potential buyers versus the number of sellers will let us know if the market is fearful or greedy. We can look at things like:
- Bidders at auctions
- Open inspection attendees
- Offers to buy
- Searches online
In the share market I don’t know how you would count buyers or sellers in this way. As far as we know, every transaction has a buyer matched with a seller – one to one.
In real estate however, we can use the online search interest:
“Online Search Interest (OSI) = searches online vs. properties for sale online”
So, I examined historical OSI data to see if an investor would have been better off buying when others were fearful.
Measuring greed by OSI
The following chart shows the relationship between OSI and capital growth.
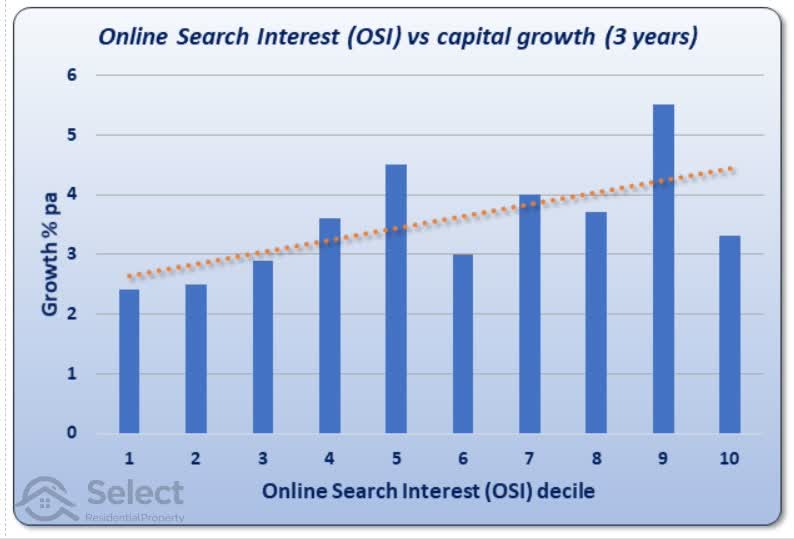
Along the bottom you can see that I have pooled property markets into 10 groups. The groups are called deciles because there are ten of them. Each property market across the country was placed in one of these deciles.
Markets with the lowest OSIs were put into decile 1 on the left of the chart. While markets with the highest OSIs were put into decile 10 at the right of the chart.
Then I looked at how history played out for each suburb in each decile. The capital growth shown up the left vertical axis is the combined growth for all suburbs in each decile over a 3-year period. This combines all the 3-year periods since records of OSI began back in 2010.
As you can see, markets in the lowest decile, that is, markets with the lowest OSI, had the lowest capital growth over the next year – a little less than 3%.
For the first 5 deciles there’s a pretty clear relationship between OSI and capital growth. That is, the higher the OSI, the more capital growth. But that relationship breaks down looking at the higher half of OSI deciles starting from decile 6.
Trend line
Overall, the relationship between OSI and 3-year capital growth can be seen in the orange dotted line. This is the line of best fit for these ten deciles. This dotted line is mathematically determined.
Because the dotted line is sloping upwards, it suggests there’s a relationship between OSI and 3-year capital growth. It means that in general, the higher the OSI, the higher the capital growth.
Note that because some bars don’t exactly follow the trend line, it means using this rule didn’t always work out.
Time-frame
Also, if you’re wondering why I didn’t pick a longer time-frame, it’s because supply and demand tend to balance out pretty quickly. Using half a dozen years as the growth period, there’s no consistent difference between the deciles – the trend line is flat.
The point of this exercise was to see if greediness is a trigger to sell. And the data shows that using this particular measure of greediness, that’s not the case. The data suggests investors should be greedy when others are. The chart also suggests that being fearful when others are fearful might be a good idea too.
But this is only one way of looking at things, hardly a convincing argument, so let’s keep researching.
Buy against the trend
Perhaps we’re measuring greed and fear the wrong way. Maybe it’s not about the number of buyers and sellers. Perhaps a better measure of fear or greed can be derived from the direction in which prices are moving. If prices are falling, this might be a better indication of fear.
- Price movement?
- Up = greed
- Down = fear
Following this strategy, we would buy into markets that are falling. So, I examined the growth rates of all Australian property markets to find those that had been falling and those that had been rising over any 12-month period.
Then I examined how prices continued to move over the next 2, 3 and 4 years. I repeated this analysis for all historical data over the last 25 years:
- Australian property markets
- Falling or rising over 12 months?
- Growth over next: 2, 3 and 4 years
- Examine 25 years of historical data
Charting fear & greed by falling prices
The next chart shows three columns reflecting the emotions of: fear, greed and neither.
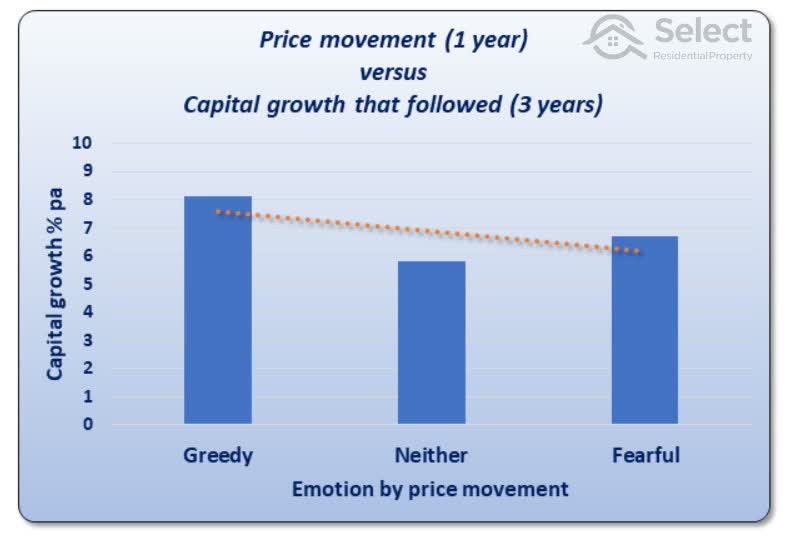
A property market was classified as greedy if there was upwards price movement greater than 4% over a 12-month period.
If prices didn’t move up that much and they didn’t move down too much either, then that suburb was classified as “Neither” greedy nor fearful.
But if the suburb’s price moved down by more than 2%, that is, negative growth, then that market was classified as “Fearful”.
This classification was performed for all property markets over all 12-month windows across the country where there was sufficient data to assume the median was accurate.
Time-frame
I chose 12 months for the period of emotion assessment. It gives plenty of time to see if a suburb is having any growth but it’s not too far into that upwards movement as to be at the peak.
The height of the bars shows the 3-year capital growth that followed on from the time these suburbs were classed as Greedy, Fearful or Neither.
As you can see, the suburbs classified as Greedy had better growth than those classified as fearful or neither. In other words, you would have been better off buying in markets that had 12-month price growth already, than buying in markets with negative price growth.
Again, I picked 3 years of capital growth because over longer periods, the growth tends to balance out. Any metric we use to choose a suburb will have virtually no long-term influence. For more on that, check out these topics:
High property growth history is a red flag
You shouldn’t focus on long-term growth
Assessment
This analysis covered literally thousands of suburbs. And the data stretched across a number of decades. The conclusion using this approach is pretty clear:
“Following a rising market is a more profitable strategy than following a falling one”
Now we’ve assessed two measures of greed and fear and in both cases, it looks better to be greedy when others are greedy. And it looks like it might be better to be fearful when others are fearful as well.
A fearful case
How about we examine a truly fearful case. This is a horror story that a handful of investors have gone through not so long ago. Some have declared bankruptcy. Others may take decades to recover. This is a genuinely heart-breaking circumstance for an investor to go through.
When the resources boom ended in 2015, there were many fearful investors trying to sell off properties in places like Dysart, Moranbah and the Pilbara. These are towns where the dominant industry was mining.
If we were to buy when others are fearful, we would be buying into those markets towards the end of 2015 when everyone else was gripped with fear. Here’s the growth chart for the mining town of Port Hedland from mid-2015…
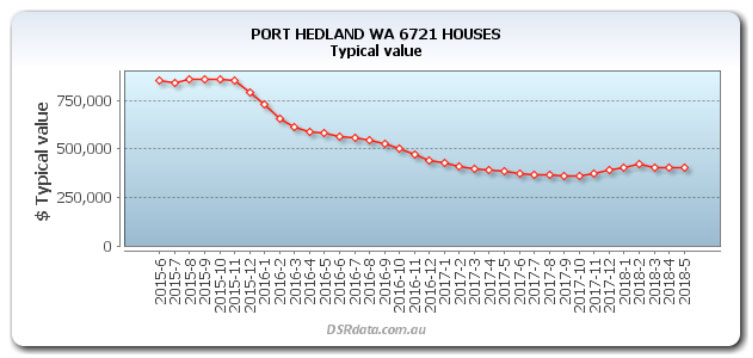
An investor would have lost close to half a million dollars buying in late 2015. That’s a half a million-dollar loss from being greedy when others were fearful.
But these were isolated cases only affecting a handful of unfortunate investors. Let’s examine a case that affected a great many investors.
A greedy case
And in this case the market was getting greedy. In 2014 Sydney property prices were taking off. Following is a chart of the Sydney median.
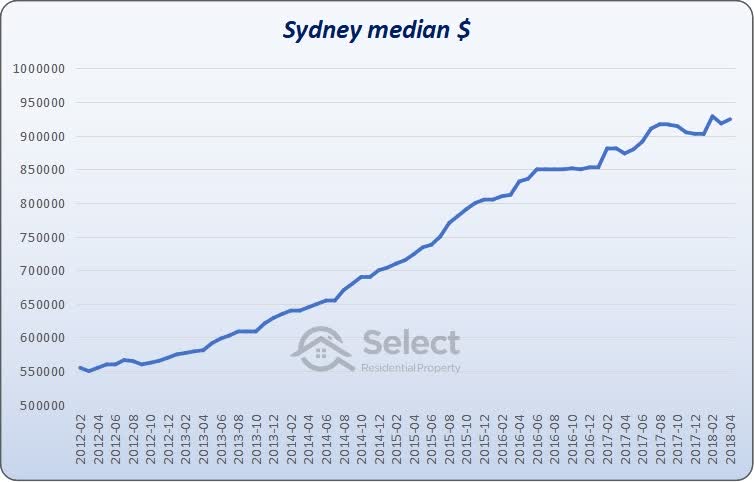
There was a lot of talk about greedy property investors being responsible for this boom. It was all over the news and there was a lot of hate towards investors. If we were to be fearful while those investors were being greedy, we would have sold in 2014.
In fact, I can remember one very high-profile expert telling her clients that Sydney was “overheated” in 2014. As you can see from the chart that mistake would have cost an investor a lost opportunity worth around quarter of a million dollars in just 4 years. Nothing boomed like Sydney did over those years.
BTW there’s another presentation in this series on that very topic. It’s called,
Buy in overheated suburbs? Yes.
Whose emotions are we gauging?
Whether it’s isolated cases with the mining towns or widespread cases like Sydney, whether we’re using online search interest or price movement to gauge fear and greed, no historical data seems to support this strategy working in Australian real estate.
Perhaps I’m misunderstanding who the fearful people are and who the greedy ones are?
You’ve probably already heard this term in property investing called the “fear of missing out” or FOMO for short. In the case of Sydney, those who were afraid of missing out were desperately trying to buy. That means investors should have been looking to sell. But as the data shows, if we sold in Sydney halfway through 2014, well into the boom, we would have missed out on about quarter of a million dollars by 2018.
Who are the others?
Perhaps I’ve got it all wrong about who the “others” are. Be greedy when others are fearful. Who are the others?
What if everyone followed this advice? How do we know everyone isn’t already following this advice? After all, it seems like everyone has heard it.
If everyone is following this advice, then everyone would be the “others”. So, we’d have to do the opposite of the others which is to not follow the advice, which would mean not doing the opposite of everyone else which would mean we’d follow the heard that is following Buffet’s advice.
“ERROR: brain melted”
It’s a bit of a vague strategy for property investors to follow isn’t it?
- How is fear measured?
- How is greed measured?
- Who are the “others”?
We don’t know how to accurately measure fear or greed and we don’t know who the “others” are.
I suspect the problem stems from some significant differences between share investing and property investing. I’ve already mentioned one – not all property owners are investors. There are two more that might be playing a crucial role: Timing & Recycling Costs
Timing
It takes a few minutes to buy some shares. And you can sell them again a few minutes later. The timeframes for doing the same thing in property would be months – literally around 100,000 times slower.
- Shares
- Buy time = minutes
- Sell time = minutes
- Property
- Buy time = 5-7 weeks
- Sell time = months
Perhaps following a trend in the share market is a bad idea since by the time you’re confident it’s a trend, it’s too late. That is not the case in property as we’ve seen. One investment vehicle can U-turn like a dingy while the other is like an oil tanker doing a 3-point turn.
Recycling costs
And there’s another massive difference between the two investment vehicles. Entry and exit costs in property are way higher.
- Entry costs (buying)
- Stamp duty $??,000s
- Legal fees $1,000+
- Reports $1,000+
- Building inspection
- Pest inspection
- Strata report
- Exit costs (selling)
- Capital gains tax (same as with shares)
- Agent’s commission $??,000s
- Legal fees $1,000+
- Cleaning $500
The stamp duty for a $500,000 property is around $20,000 depending on which state or territory you’re buying in. On top of that there are legal fees and inspections which can add up to a few thousand more.
Real estate agent commissions are around 2% as a very rough guide. For a $500,000 property that’s ten thousand dollars.
All up if you wanted to buy and sell a property, it would cost you around 7% of the property’s value. For a $500,000 property that’s $35,000.
That kind of money makes you think long and hard before making a move, right? It’s a lot easier with shares.
It’s these kinds of differences and how massive they are that triggers alarm bells that a strategy for share investing may not apply so well to property investing. But everyone loves the contrarian approach. And maybe that’s the angle we should take…
Contrarian view
Here’s a way to look at things so in some way we can say we’re kind of following Buffet’s advice…
Buyer’s market
In real estate, a “buyer’s market” is one in which it’s easy for buyers to buy.
- Buyer’s market
- Supply exceeds demand
- Easy to buy
- Seller’s market
- Demand exceed supply
- Easy to sell
There’s little competition from other buyers in a buyer’s market because other buyers are scarce. There’s plenty of property to choose from and vendors are quite negotiable. You can easily walk away from one deal because there are so many more. In other words, there’s loads of supply and not much demand. And that makes it “easy” to buy.
Seller’s market
A seller’s market on the other hand is the complete opposite, demand exceeds supply. There are too many buyers and not enough properties. Sellers don’t budge; buyers outbid each other; and properties get snapped up quickly.
Supply and demand are the sole dictators of price growth. When demand exceeds supply, prices go up. So, if we’re to catch that wave, we need to buy when demand exceeds supply.
- Buyer’s market
- Supply exceeds demand
- Easy to buy
- SELL
- Seller’s market
- Demand exceeds supply
- Easy to sell
- BUY
That means we need to… buy in a seller’s market. It also might mean we should sell in a buyer’s market. There you go, there’s your contrarian view, one that should apply pretty well to property investing. Use supply & demand to determine whether it’s a seller’s or buyer’s market. Then buy in a seller’s market.
Conclusion
Apologies to all those who worship the Warren. I hope I didn’t denigrate his wisdom. I just wanted to point out that property is a little different from shares and sometimes his remarks are taken out of that context.
What annoys me most is when wanna-be experts quote Warren Buffet in an attempt to align themselves with him merely to win your trust. Be careful who you listen to and better still: learn to question all advice you hear. It’s probably best to get in the habit of thinking for yourself anyway.
If you really must do the opposite:
“Buy in a seller’s market and sell in a buyer’s market”