Introduction
This month I investigate where one of the enemies of property investors is gathering. Yes, we have enemies. Supply is the big one since it thwarts capital growth.
We need to identify currently over-supplied markets and avoid them. But we also need to recognise areas with potential for future over-supply.
Measuring
Supply is the count of properties currently for sale. Here are 2 examples of the count of houses for sale in Melbourne at the end of November 2020:
- Reservoir VIC 3073 around 150
- Collingwood VIC 3066 around 15
Reservoir had 10 times the number or houses for sale than Collingwood. But Reservoir is not over-supplied with houses. Check out the total count of houses in each suburb that are not for sale:
- Reservoir VIC 3073 around 13,000
- Collingwood VIC 3066 around 1300
Reservoir has about 10 times as many houses as Collingwood. So, naturally you’d expect it to have more for sale simply because there are more there.
This is why we don’t consider the number for sale. Instead, we consider the percentage for sale. We call this the percentage of stock on market of SOM%.
It turns out both Collingwood and Reservoir have about the same SOM%. And neither are over-supplied.
Normal SOM's
About 1% is considered normal for most suburbs. Anything less than 1% is a rough indication of limited supply. But there can be inaccuracies in measuring SOM%. When it gets less than half a percent though, it’s a pretty clear indicator.
There are loads more metrics to consider, so don’t be alarmed if your suburb’s SOM is 1.25%. But…
Bad SOM's
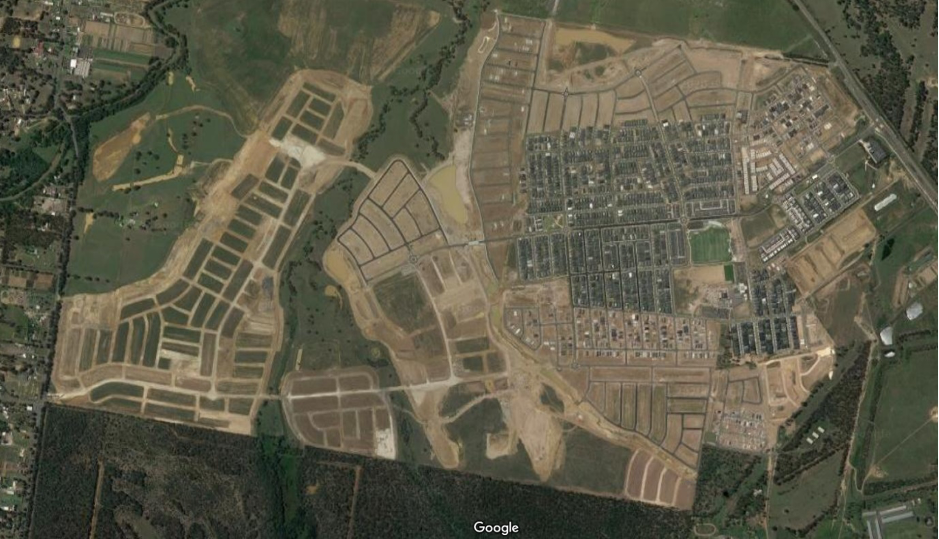
You should worry if the SOM is 12.5% like for Marsden Park in western Sydney. The following complicated info-graphic is the Context Ruler for SOM% for Marsden Park for November 2020.

The ruler shows a spread of SOM% figures from good (left) to bad (right) for all suburbs across Australia at the end of November 2020. You can see the national average is around 2% (top left) and the median is around 1.3% (bottom left). But Marsden Park houses are in the red zone at 12.5%, which is terribly oversupplied.
Marsden Park is the typical greenfield estate with a lot of land opened up for subdivision and house & land packages.

Note that because property can be sold off-the-plan, it’s possible to have an SOM greater than 100%. That is, there can be more properties for sale than there are properties currently in the suburb!
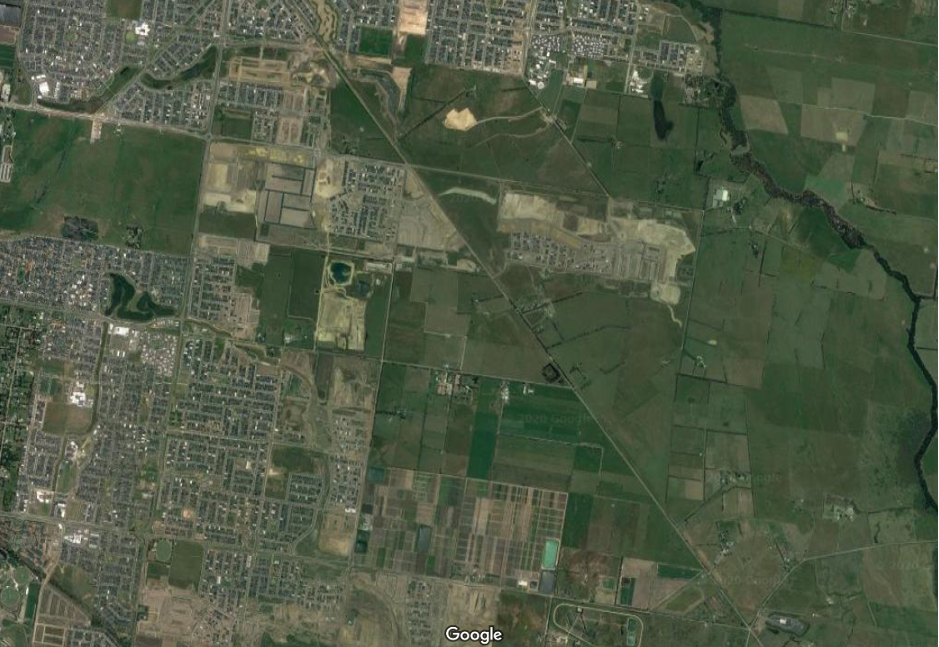
Here’s another example of over-supply:

And the satellite imagery is a strong warning to investors that this area could have a lot more houses supplied in the future.

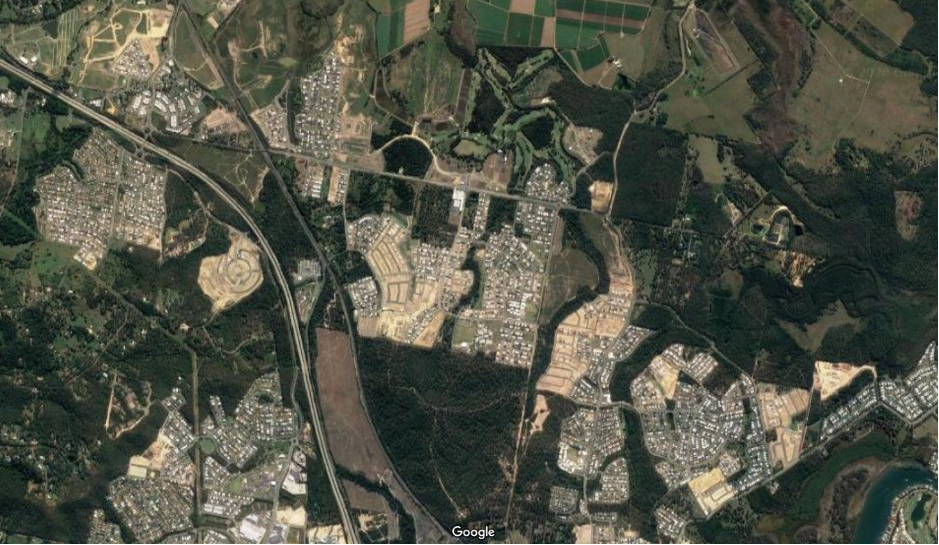
Here’s another good example. This is for Coomera and Pimpama. They’re about halfway between Brisbane and the Goldie.

The brown landscape scars are ironically called “greenfield estates”. Developers move in and fell all the trees to divvy the parcels of land up.
Once again, the SOM% context rulers tell the story numerically:


A Good SOM's
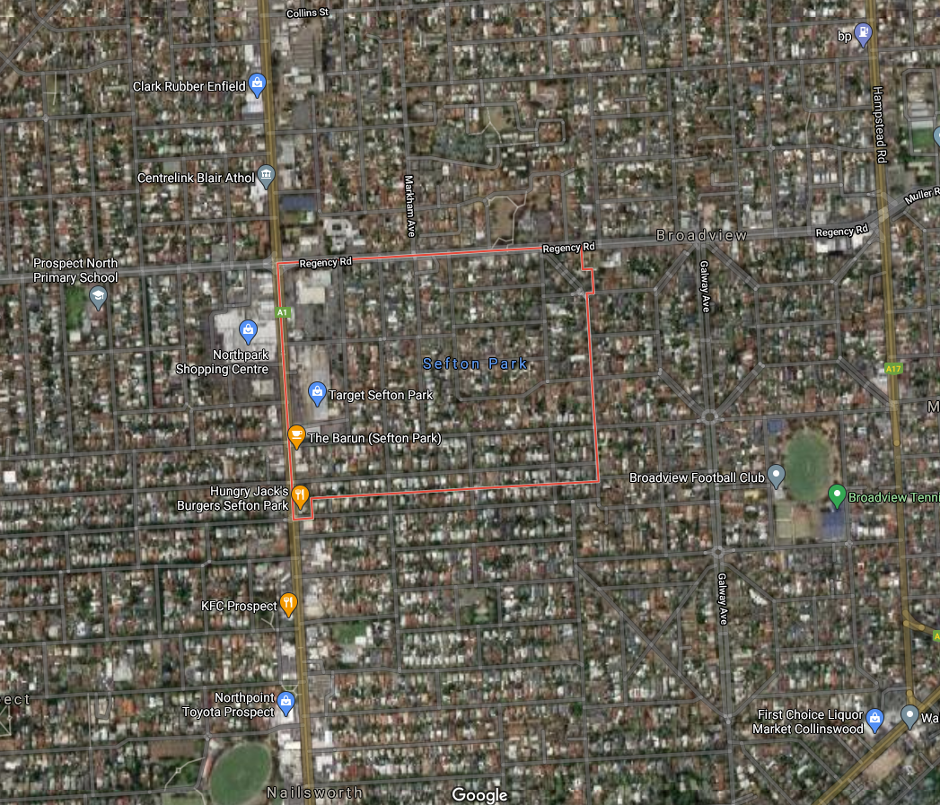
Here’s an example of really tight SOM%…

And not much room for oversupply of houses into the future either…

Summary
Use satellite views to avoid areas with potential for over-supply of houses in the future. And check the SOM% to avoid current high supply areas.
Note that the only way to protect against unit over-supply into the long-term future, is to buy a house instead.
Not every suburb is as clear-cut as the ones I’ve shown here. So, keep supply in perspective, it might be a little high in some suburbs, but don’t be alarmed, demand might be a little high there too. The real problem spots are where demand is low and supply is high i.e., a low demand to supply ratio.

Commentary by
JEREMY SHEPPARD
Director of Select Residential Property
Founder of DSR Data


