What is an OFI?
An “Open for Inspection” (OFI) is a time when buyers can come to view a property that has been advertised for sale. The alternative to an OFI is to arrange an appointment to view the property at a time suitable to the owner, agent and buyer.
What’s the Big Deal?
The percentage of properties listed for sale with an OFI, indicates the nature of supply & demand for property. If demand is high relative to supply, then prices should rise. That’s important for investors pursuing capital growth.
How OFI shows Supply & Demand
Imagine you’re a real estate agent. You list a property for sale and you get a call next day from an interested buyer that wants to have a look. You contact the owner and arrange a time to visit. After the interested buyer has had a peek, you get back to the office and sit down for 2 minutes before you get another call. It’s another buyer wanting to inspect the property. You arrange another time with the owner for the next day. A day after that, you receive yet another call!
The market is hot and you’re wasting your time and the owners’ arranging all these viewings. What would be better is if every interested buyer turned up at the same time. That’s why agents have open inspections.
But they don’t have them in every case. Imagine you’re a different real estate agent, one on a very different area where things are very quiet at the moment. You arrange an open inspection and turn up early. The owner has cleaned the place up nicely. You wait for the first attendee. And you wait. And you keep waiting. And nobody shows.
What a waste of time. It would have been better to ask any interested buyer to contact you to arrange a time to view the property. What works well in one market is a waste of time in another.
Agents use OFIs more when the market is hot and less when it’s not. So, the percentage of properties being listed for sale with open inspections is a “read” on the nature of supply and demand for a property market. The higher the percentage, the higher demand is relative to supply.
What’s a Good % OFI?
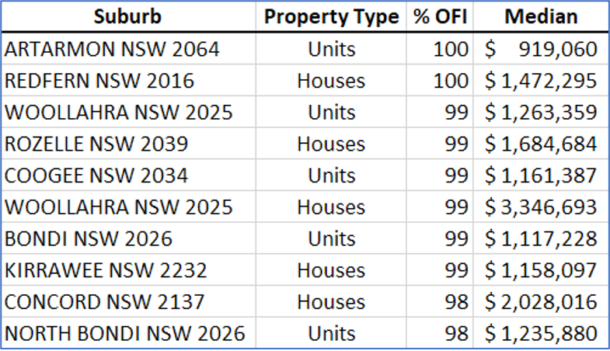
The following infographic shows an extreme case of high OFI.

You can see the average % OFI nationwide at the moment is around 60%. But units for sale in Artarmon all have open inspections, 100%.
Culture
But in another part of the country, the procedures of agents may be very different. So, a better approach might be to watch the…
Change in OFI
The following chart shows how the national OFI has changed recently.
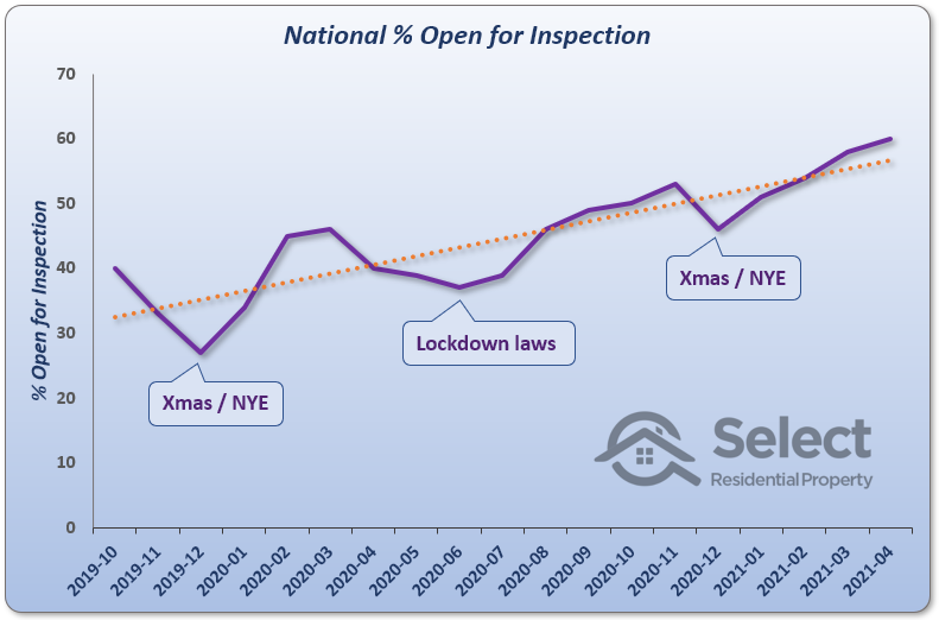
Overall, the move has been upwards recently. That means demand has risen with respect to supply.
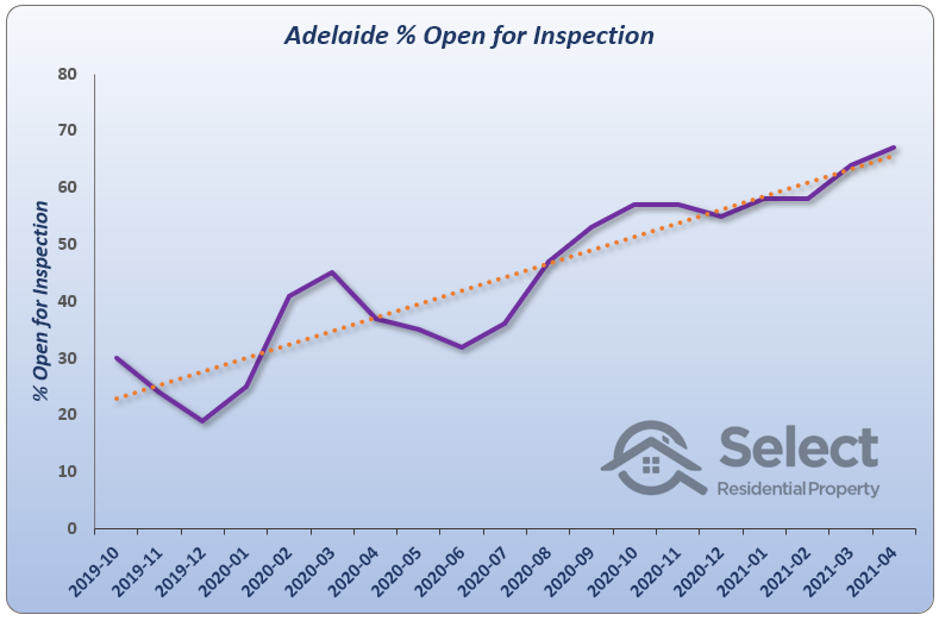
Adelaide has had the biggest move rising by 40% in the last year or so.
Perth has had the biggest increase in percentage terms…
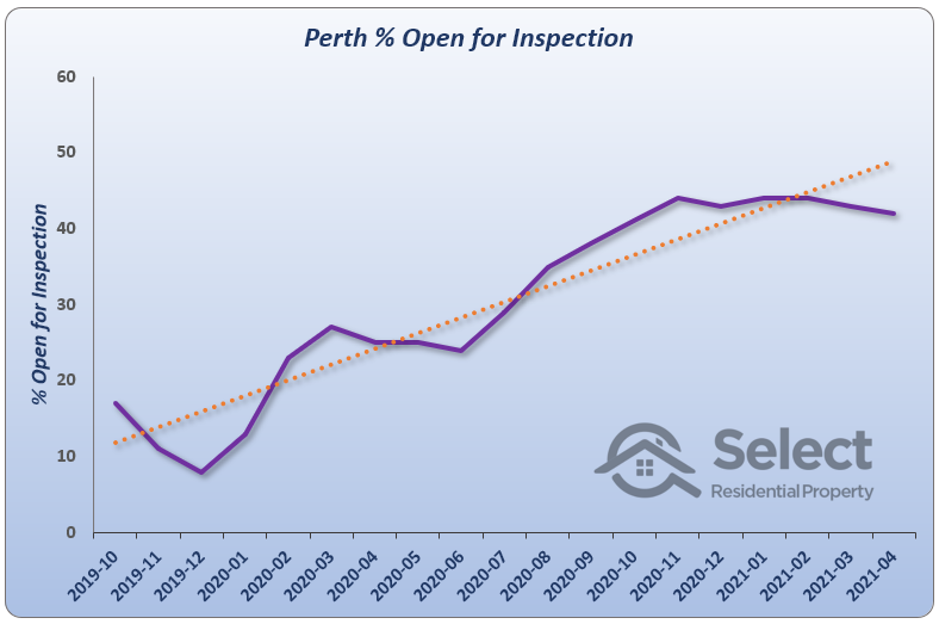
But it was coming off a pretty low base. It’s still only at 40% – which is below the national average.
Canberra has the highest average % OFI out of all the state capitals at around 85%…
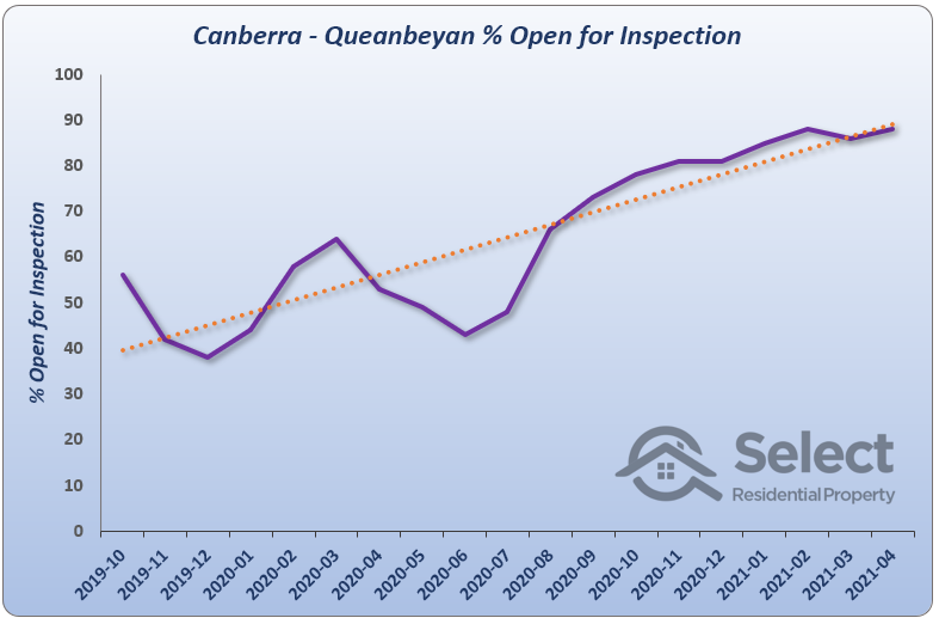
Despite how high Canberra – Queanbeyan’s OFI was 18 months ago, it’s still risen noticeably.
Warning
The % OFI is only one way to read a suburb’s supply and demand. There are many more, like: auction clearance rates, selling speed, discounting, neighbour price balancing, market cycle timing, etc. Don’t rely completely on only one metric. The true power comes from combining many metrics to find suburbs with the best demand relative to supply.

Commentary by
JEREMY SHEPPARD
Director of Select Residential Property
Founder of DSR Data


