It doesn’t look like the property market is going to be sucked into a black hole. In fact, there are signs of a spending spree ahead. In particular, selling times are falling.
At SRP, when a property is first listed for sale, we make a note of the date. Later, when it sells, we measure how long it took. This is the “Days on Market” or DOM. We calculate a suburb DOM each month by taking the average for all properties that sold. And suburb DOMs can be averaged for a city DOM.
City DOM's
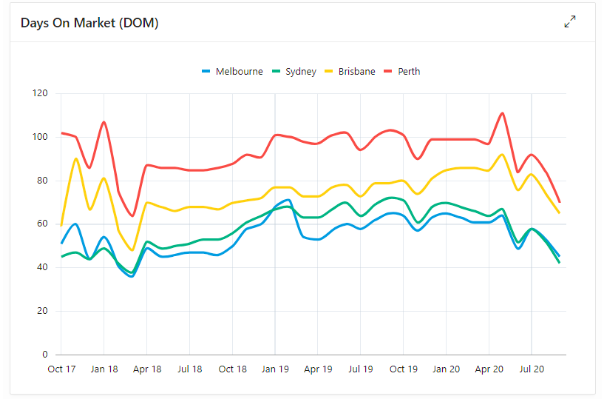
In a hot market, if a tardy buyer misses out on a property, they don’t muck about with the next one. So, the DOM is a good measure of demand relative to supply.
You can see from the prior chart that the average DOM for the big 4 has taken a sharp nose-dive since April. It’s not necessarily a pandemic thing though. Sydney and Melbourne DOMs already started dropping towards the end of 2019.
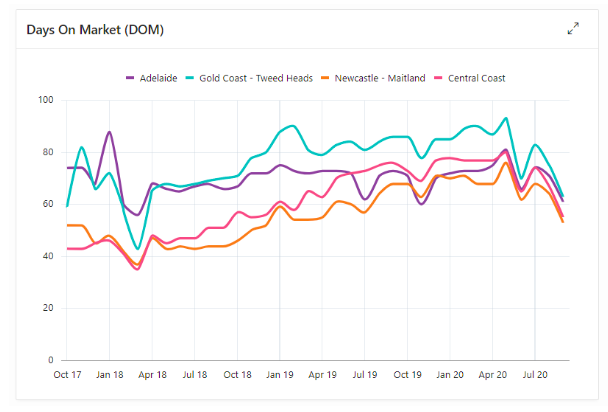
Over the last 3 years, selling times in most large population centres peaked around May 2020. And then fell off a cliff.
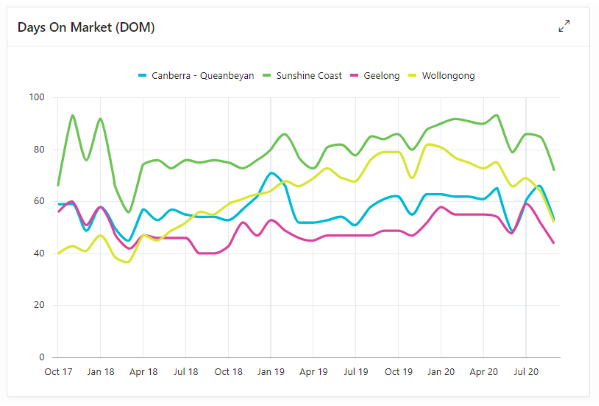
Wollongong’s DOM started falling from January 2020. Canberra has been Mr Consistent.
Look how quick you have to be in Hobart…
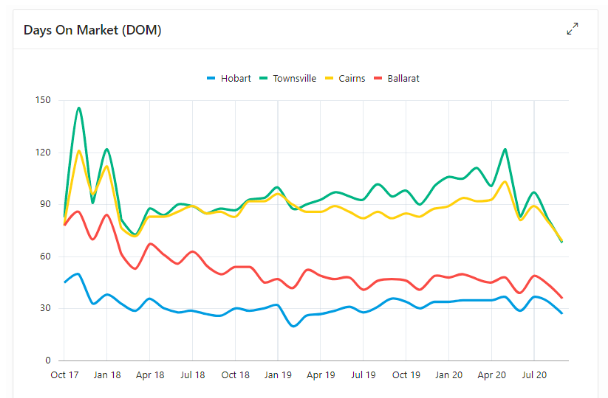
Notice how Ballarat’s impressive DOM fell sharply in early 2018 and has been low-as since.
These are good signs capital growth is on its way to a lot of Australian property owners.
Fastest DOM's
Some of the fastest selling times*:
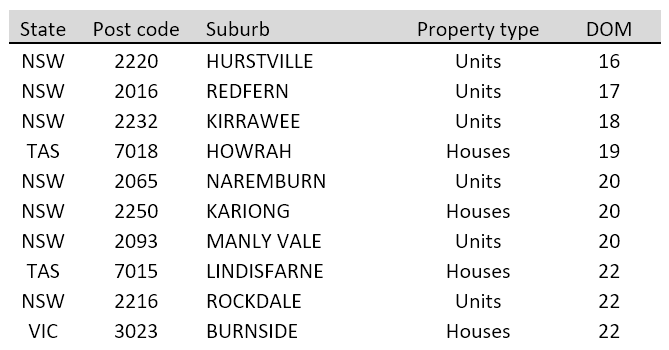
*with sufficient statistical reliability
At the other end of the spectrum, some no-go zones:

Some of these are in remote or mining areas where the market is on life-support.
Big Changes
An example of a worrying case is that of Jurien Bay in WA.

Sellers are waiting about 8 months to get a sale.
It’s a different story in Kangaroo Flat in Bendigo.

A few years ago, properties were taking twice as long to sell. It’s a good sign for Bendigo.
Heads-up
Note that property markets quite often have conflicting metrics, like a good DOM but a bad vacancy or high stock on market. It’s important to look at more than one metric when making your growth assessment.
Commentary by:
JEREMY SHEPPARD
Director of Select Residential Property
Founder of DSR Data
“Capital growth is the ants pants of property investing.”


