Introduction
Most counter-cyclical investors will tell you to buy at the bottom and possibly even sell at the top. Easier said than done. How do you know if a market is at the bottom? That’s one of the major reasons why you shouldn’t buy at the bottom – because you don’t know. But there are more reasons.
An example
The following chart shows the change in median for a certain state capital.
This city shows the typical surge and slough of market cycles. There’s a rapid rise in values, followed by a levelling off, possibly even a correction and then the upward growth starts again.
Looking at the chart, do you think this market is about to start its next surge of growth? Let’s add in some dollar values and dates.
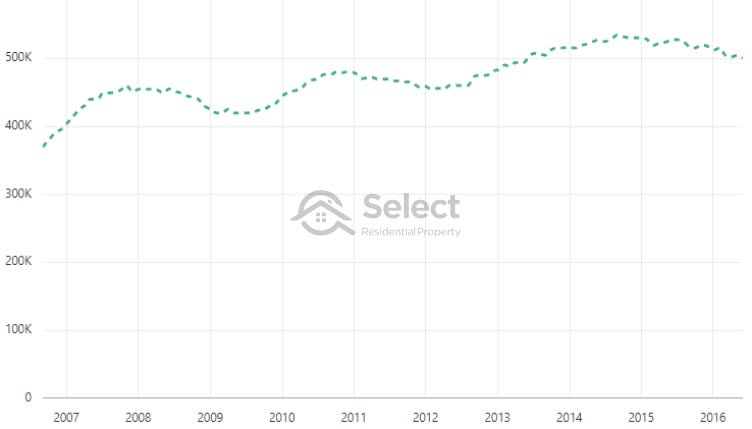
You might think 2016 would have been a good time to invest in this market. It looks to be at the bottom of its cycle in mid-2016.
Indeed, that’s when experts first suggested investors to start buying there. This is one of Australia’s largest cities. Here’s what happened over the next year:
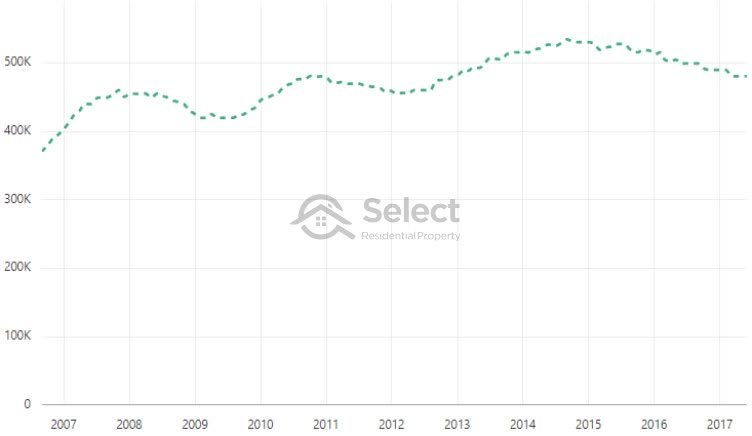
Prices fell about another $20,000. The experts got even louder and here’s what happened over the 2nd year:
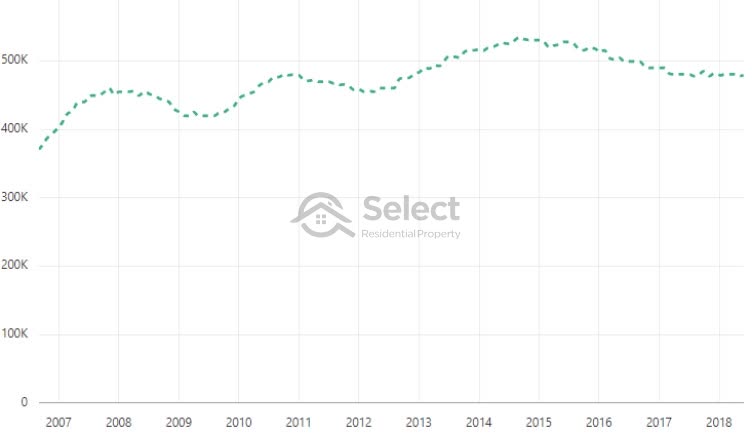
At least prices stopped falling, but still no benefit for investors. Those who thought it was at the bottom in 2017 were still waiting and kept waiting across 2018 and well into 2019 as well.
The city is Brisbane. Growth in property prices has barely managed to keep up with inflation for the last decade. But as early as ten years ago, some “experts” have been pumping it up. Admittedly, most of those “experts” were really just property developers disguising themselves as investment experts trying to get investors to buy.
Here’s what happened elsewhere in the country around 2017:
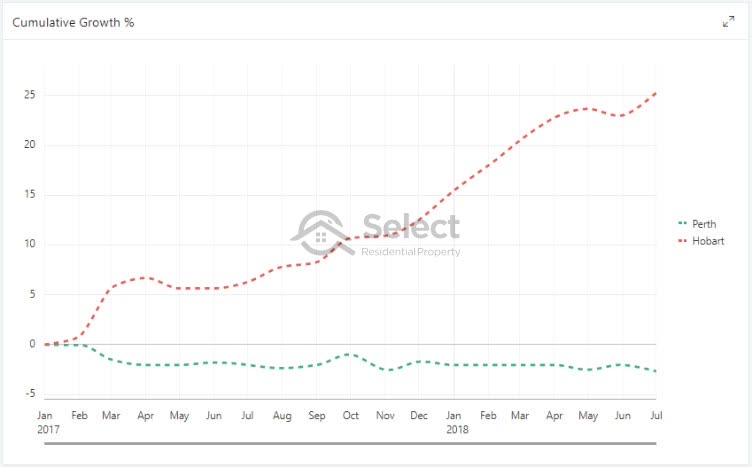
This chart compares the growth of Perth against the growth of Hobart from January 2017 to mid-2018.
Not only did Perth investors cop an extra loss, but they missed out on staggering gains elsewhere.
So, when did Hobart reach its bottom?
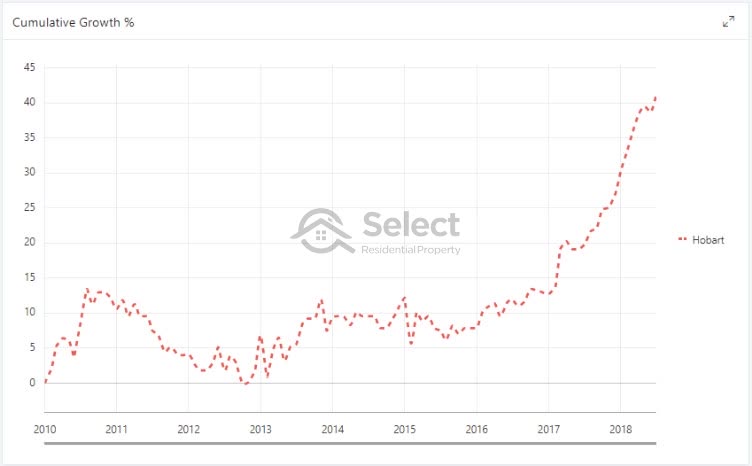
The chart shows that Hobart bottomed in late 2012, had a brief respite and bottomed a second time in 2015.
Most counter-cyclical investors would have picked 2013 as the bottom.
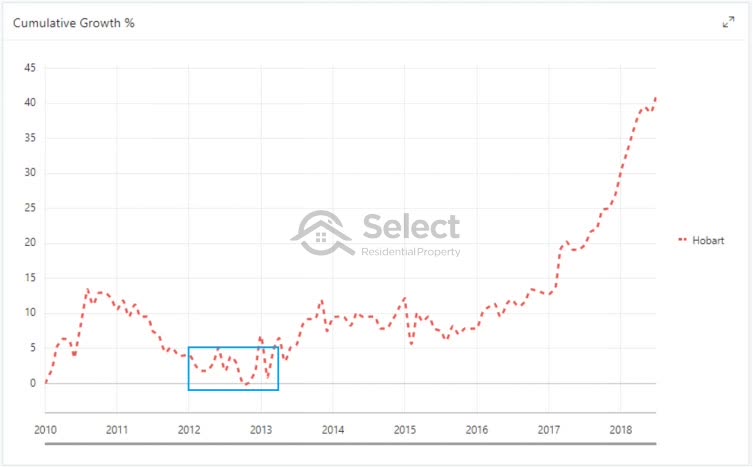
But if they had, they would have been holding on to an underperforming asset for 4 years. From 2013 to 2017 Hobart’s average growth rate was less than the national average and barely managed to beat inflation.
The best time to buy in Hobart wasn’t when it was at the bottom.
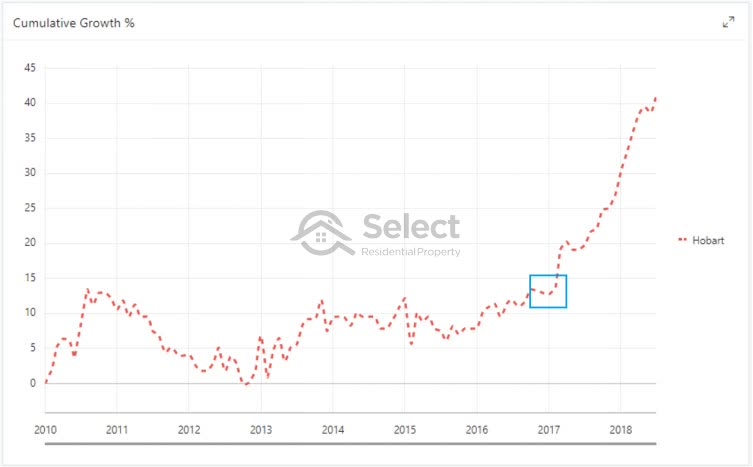
The best time to buy in Hobart was nowhere near the bottom – it was well after it, around late 2016 or early 2017. Investors who bought in Hobart in the latter half of 2012 had to wait 5 years to see double-digit growth.
Even those who bought in Hobart in 2014 had only about 5% growth in total over the next 3 years. During those 3 years Sydney piled on nearly 40%.
If you try to buy at the bottom, there’s a chance you’re not quite there yet and you endure further falls. Investors think that property markets turn on a dime. They think once a market has hit the bottom, it bounces straight back up again. It doesn’t, it sits on the bottom for a long time.
So, even if you’re good enough to exactly time the bottom, you’re still too early because there’s usually an extended flat period following the bottom.
“The fastest rate of growth rarely follows on immediately after a recovery”
It might take a year or two before the market booms again and that’s if you’re lucky. Mediocre growth can hang around for nearly a decade in some cases.
Sydney’s boom from 2013 to 2018 consisted of about 70% capital growth over the entire 5-year period.
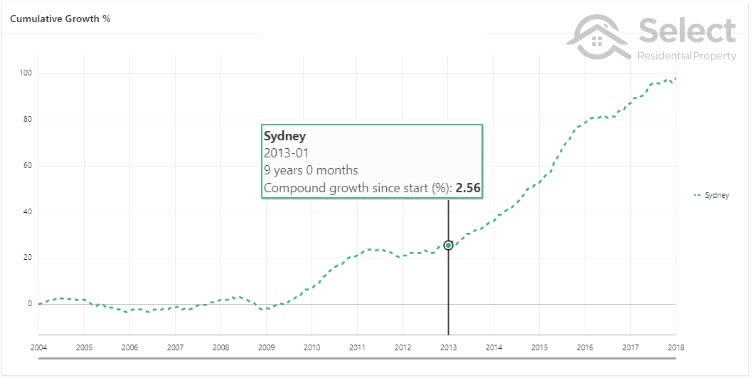
But for the 9 years preceding it, the compound growth rate was only about two and a half percent.
The following chart shows another example.
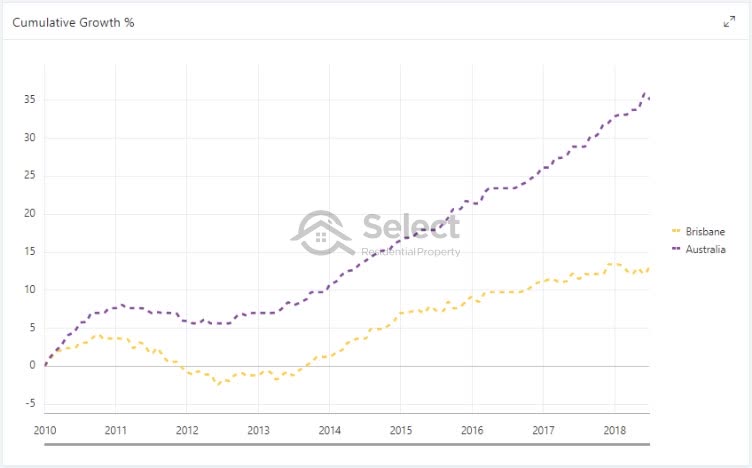
Brisbane had a tough time from 2011 to 2013 but then recovered. But was this an opportunity to buy at the bottom?
No, despite how good the growth appears, it underperformed the Australian average growth rate for the entire period shown on the chart. Even the growth rate from 2013 on was only 2.5% per annum. It didn’t stay at the bottom, but it didn’t tear up afterwards either.
How long then?
Research I conducted to estimate the period of time a property market spends in these lack-lustre growth periods found that the typical market cycle lasts about 5 years.
Approximately 31% of a market cycle is spent in boom with double-digit growth per annum.
29% of the cycle is spent in a flat or declining phase of 5% or less growth per annum. This includes negative growth or corrections.
And for 40% of the cycle, the market growth is moderate.
- Cycles last very roughly 5 years
- 31% of the time is in boom
- 29% of the time is flat or bust
- 40% of the time is moderate growth
Conclusion
It takes a long time for an economy to recover and for prices to find their new balance point.
Don’t simply buy at the bottom expecting prices to bounce right back up again. It takes many years of being in a recovered economy for confidence to return to buyers and for demand to build up again.
Waiting for the start of a boom is a much safer and time-efficient strategy for property investors. Although you may miss out on the early growth, if you have your finger on the pulse of property markets around the country, you can get in early enough to collect the lion’s share of the growth.
Property markets move very slowly, especially large markets like state capitals. They can’t turn around like a dingy with an outboard. They’re like oil tankers. There’s plenty of time to watch them do their 3-point turn. Once they have, jump in and swim with them rather than against them.
- Don’t buy at the bottom
- Wait till the recovery
- Property prices move slowly
For more counter-cyclical intelligence, check this controversial topic out: