Introduction
How many times have you heard an expert say that you should invest in property markets with high population growth? It’s a no-brainer, right?
WRONG!
High population growth doesn’t mean what you probably think it does regarding capital growth. In fact, it could mean the complete opposite.
The theory
The theory makes sense: assume a fixed number of properties and a growing number of people who need a property. The increased demand for a limited supply equates to price rises.
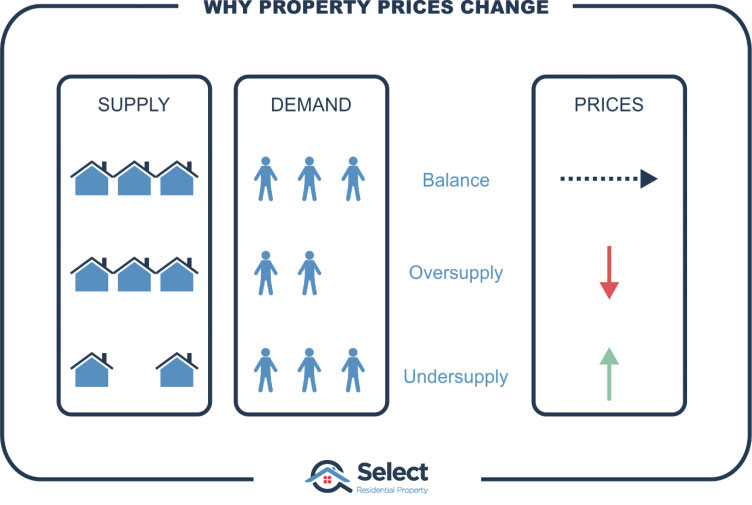
Supply & demand
The key to getting high capital growth is finding markets in which demand exceeds supply and to the greatest degree.
It’s a fundamental economic law. If demand exceeds supply (undersupply), prices rise.
But here’s the thing. Population growth isn’t a measure of demand exceeding supply. It’s more likely to indicate a case where supply exceeds demand – oversupply.
Here’s why…
Problem 1 – you’re lucky if demand matches supply
People do not move into a suburb living on the streets waiting for the property to become available. Instead, they move into an already vacant dwelling.
A property must be vacant for a new occupant to move in. If the property is vacant, there’s oversupply. And if the property is occupied, demand is matched with supply 1 for 1.
Imagine 100 new houses are built.
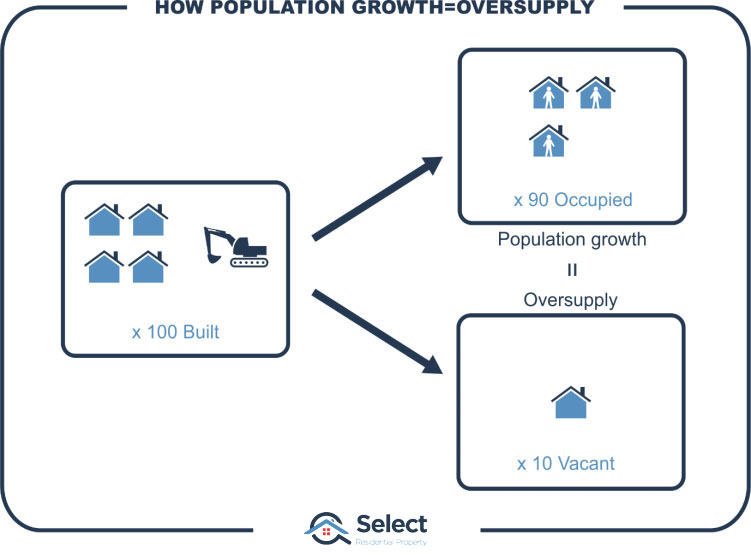
At the time they’re finished, there are 100 new properties supplied to the market. If only 90 of these are occupied, then there are 10 over-supplied. But the population increased by 90 new households.
Population growth at the suburb level never measures a case where demand exceeds supply. At best it can only measure the case where new supply is precisely matched with demand. And in most cases, it’s indicating some level of oversupply.
Exceeding
Investors pursuing capital growth need to find markets in which demand exceeds supply, not matches it. Population growth figures can’t help.
What we really need is the number of people who missed out. That is, the number of people who couldn’t move into this location but wanted to. That’s a case of demand exceeding supply.
Problem 2 – babies don’t buy houses
There’s another problem though. In order to calculate a change in the population we need to know:
- Population at the start of the period
- How many people moved in & out during the period
- Count of births and deaths
Now here’s something you might already be aware of: babies don’t buy houses. If births are the predominant cause of population growth, there won’t be pressure on prices to rise. Without a breakdown in the cause of population growth, investors are buying blind.
Problem 3 – how population grows
Now, let’s go through the only three ways in which a suburb’s population can grow.
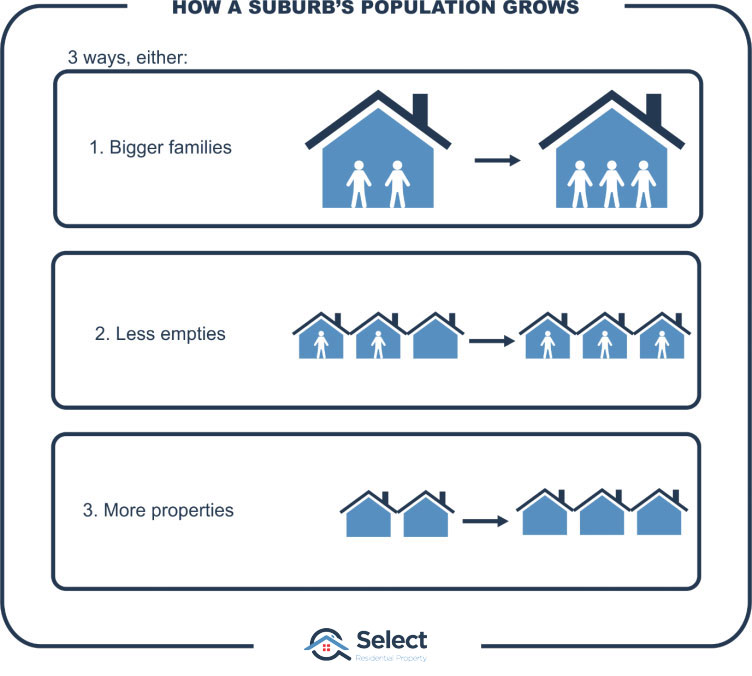
- Bigger families – i.e. more people living in the same dwelling
- Reduced vacancies – i.e. fewer empty dwellings
- More dwellings – and people in at least some of them
Bigger families
Let’s look at the 1st case, stuffing more people in one property.
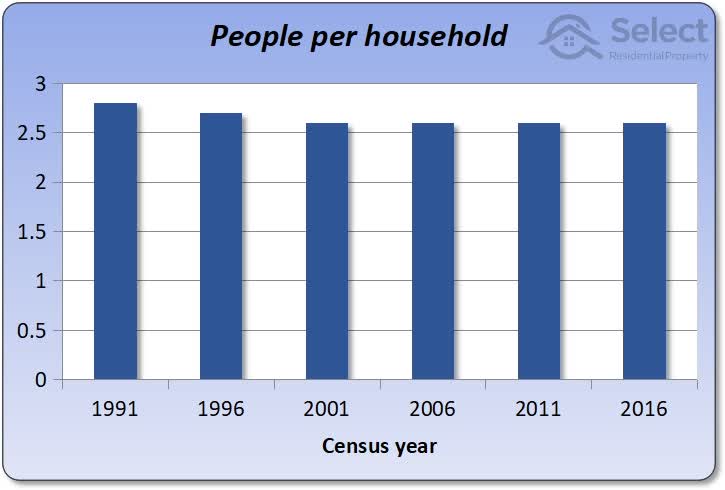
This chart shows that there’s been no change in the density of people per household for the last 4 censuses. But going back further, the density of people per household has actually decreased, not increased.
There needs to be a significant change in the demographics of an area to have significant population growth caused by family densification.
But what if the people per household did increase? What if it doubled! Well that would mean the population would double without the need for any more property. So, in that case population growth would be 100% but demand for property would be unchanged.
If a growing population makes do with the same number of dwellings, then there is no pressure on prices to rise. For prices to rise we need more people wanting their own property. So, if population growth occurs via increased people per household, population growth will have no impact on demand.
Reduced vacancies
Let’s look at the 2nd case, reduced vacancies.
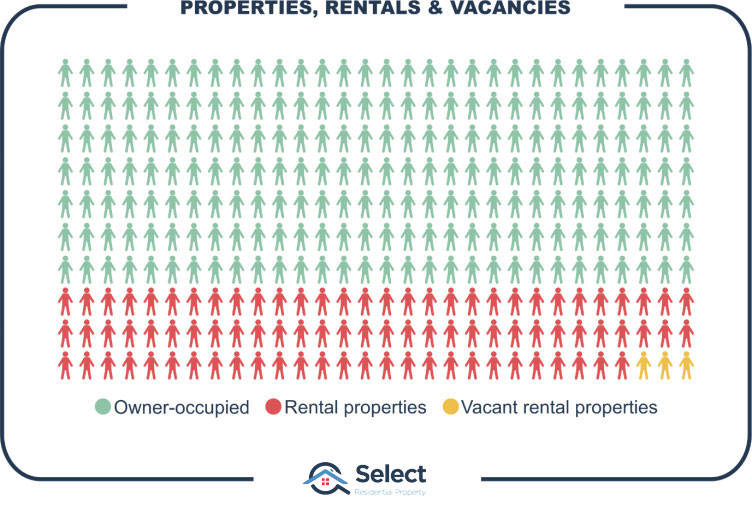
About 30% of properties in a typical Australian suburb are rentals. If 3% of those rentals are currently vacant, then the population can grow by about 1% without any new dwellings being built.
Remember, the vacancy rate is a measure of how many rental properties are vacant, not how many properties in total are vacant.
In order for the population to grow by 1% via decreasing vacancies, we’d need the vacancy rate to come down from 3% to zero percent. In other words, you would need the lowest vacancy rates in history just to increase the population 1% by this method.
More dwellings
The 3rd way in which population grows in a suburb is the only way in which it can happen in a significant way. The major reason why a suburb experiences big population growth is through heavy development activity – more homes. Those locations where the most supply of new property is coming onto the market are those locations about to get the highest population growth figures.
But supply is the enemy of capital growth.
“High population growth for a suburb is more likely an indicator of supply than of demand”.
Imagine getting supply and demand round the wrong way!
“In fact, I’d prefer to buy in a suburb where population growth is simply impossible.” This means I’m in a suburb that doesn’t have a future risk of over-supply. More on that in a minute.
Population growth forecasts
Alright, now I want to cover forecast population growth. Have you ever heard one of those forecasts for population growth? E.g.:
“The population is expected to increase by 30,000 people for the region over the next 10 years”
You can picture a queue of people lining up at the gates wanting to get in.
https://www.youtube.com/watch?v=Z1mc8LCe0tc (World War Z video snippet showing zombies climbing a wall trying to get in).
That would indicate demand… if that’s what the estimate was based on. But that’s not what the estimate is based on. The estimate is actually based on supply.
The council and developers figure out how many more apartments can be built…

…and what land can be cleared to build new houses. Then they assume a portion of those will be occupied.
The forecast population growth is based more on what can be supplied not so much on what’s demanded.
Population growth at this level is not an indicator of demand, but an indicator of supply.
Growth corridors
By the way, if you ever hear the term, “growth corridor”, don’t think for a second this means “capital” growth. On the contrary, it is growth in supply, the very opposite of what a property investor wants. Avoid growth corridors if you want capital growth.
Interestingly, capital growth can happen with zero population growth. It happens a lot in fact.
No denser development
Imagine a council deciding they’ve had enough in-fill or densification for a while. They decide that if you knock down a house, you can only build another house – not a duplex. There will be no more new apartment complexes and townhouses. “It’s dense enough already” they say.
Now, this sort of policy might easily be applied in CBD fringe or inner-city council zones for example.
Now do you really believe that for 10 or even 20 years there would be virtually zero capital growth for such a property market simply because there is no population growth?
On the contrary, those people looking for less dense accommodation may, over time, consider this council area an oasis in an ever-denser city. That increased desirability of the location may accelerate capital growth.
It’s not hard to picture this kind of area doubling in value in 20 years. That’s not uncommon. What it would mean is 0% population growth and yet 100% capital growth. Population growth and capital growth do NOT go hand-in-glove.
Greenfield estates
Another example where population growth and capital growth do not walk arm in arm is that of new estates on the outskirts of a major city. Picture a sparsely populated relatively rural area about to become the most recent victim of urban sprawl.
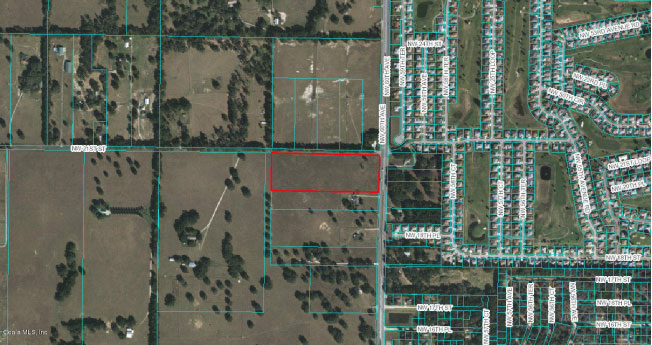
This area may consist of very large blocks of mostly farmland.
A developer buys up the land from farmers to chop up into blocks to sell off. Now imagine their development plans are delayed, perhaps by council holding things up; or maybe from complaints by local land owners; perhaps by finance problems; or problems faced by council in providing the infrastructure like roads; or maybe they’re just land-banking.
Let’s say these delays dragged on for 10 years. And during that period the city started bursting at the seams. It’s possible that prices for a block of land may have doubled in that time.
Yet the population of that land hasn’t budged. It is still farmland remember. We don’t count possums. Here we have another case of 0% population growth and possibly 100% capital growth.
Again, the population growth data for a suburb betrays the potential for capital growth.
Now these are just hypothetical examples. Let’s see some real cases:
A real example
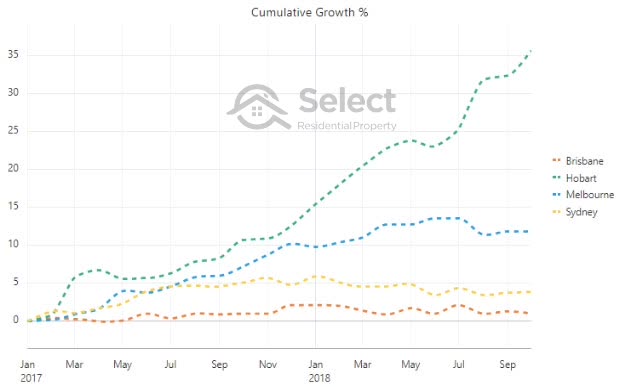
This chart shows the capital growth of some cities in Australia you may have heard of. And in terms of capital growth, Hobart has been the best performing city in the country since the start of 2017 to the time of writing with about triple the growth of second best.
But Hobart has had population growth about a 5th that of the rest of the country for the 5 years up to the end of 2018. In other words, if you were using population growth as a lead indicator to pick where to invest, you would have avoided Hobart running up to 2017. But what happened, it boomed.
More examples
Toowoomba
Pop. growth of 0.3% p.a. from 2006 to 2011
Cap. growth of 3.8% p.a. from 2011 to 2016
Cairns
Pop. growth of 6.4% p.a. from 2006 to 2011
Cap. growth of 1.8% p.a. from 2011 to 2016
Townsville
Pop. growth of 4.1% p.a. from 2006 to 2011
Cap. growth of -1.9% p.a. from 2011 to 2016
Sydney
Pop. growth of 1.4% p.a. from 2006 to 2011
Cap. growth of 9.4% p.a. from 2011 to 2016
For each city, I’ve shown the population growth followed by the capital growth.
Toowoomba for example, had low population growth for the 5 years from 2006 to 2011. And from 2011 to 2016 it also had low capital growth. So, if you were using prior population growth data to forecast future growth, this example would have worked.
But Cairns had whopping population growth, literally more than 4 times faster than the national average. But what happened next, it had less capital growth than Toowoomba! So, if you’d used the same policy, it would not have worked.
Townsville over the same time-frame had population growth almost triple that of the national average, but negative capital growth. So, again, this is a case where it didn’t work out.
And lastly, Sydney had population growth bang on equal to the national average yet had well-above average capital growth.
So, there are 4 examples of completely contradictory cases. Population growth and capital growth do not go hand in glove.
More reasons
There are a few more reasons why population growth data is of little use to property investors.
The data is published infrequently. Suburb population growth data comes from the Australian Bureau of Statistics from their census which is conducted once every 5 years. A lot can change in 5 years.
There’s also a delay in publication. It takes about a year. So, best-case scenario, the data is a year out of date and worst case, it is 6 years out of date.
And it’s a lag indicator, it tells us what has happened, but can’t really tell us what will happen.
Fake evidence
Now you may get some smarty pants claiming to have seen high growth in suburbs with high population growth and loads of new properties being built. This is fake growth, it’s actually median growth, not real capital growth.
You see new properties typically sell for more than older properties of the same kind. A new house will sell for more than an old house in the same suburb.
So, imagine you have $500,000 older properties selling and $600,000 new properties selling in the same suburb.
- Old = $500k
- New = $600k
Every old property sells for the same amount as does every new property.
- $500k old
- $500k old
- $500k old
- $500k old ← Middle = Median $500,000
- $600k new
- $600k new
- $600k new
If more old properties sell than new ones, the median is $500k.
But if more and more new ones are built and sold, the median shifts.
- $500k old
- $500k old
- $500k old
- $600k new
- $600k old ←Middle = Median $600,000
- $600k new
- $600k new
- $600k new
- $600k new
Neither old nor new properties have had any capital growth. Old properties are still selling for $500k and new properties are still selling for $600k. But the median has gone up 20%. It’s not real capital growth, it’s fake growth. And it occurs all the time where there is heavy developer activity.
Conclusion
Alright, in summary, population growth is not all it’s cracked up to be. Yet for decades it’s been shoved down our throats as a must-have research parameter. As you can see now, it’s more likely to be an indicator of oversupply than an indicator of demand.
Don’t be fooled by the marketing of developers, their project marketers and business partners or near-experts who don’t know any better. If you see high population growth for a suburb, you should avoid it.
