Introduction
When I was a novice property investor, it was drummed into me by the experts of the day, that you buy and never sell. There are huge costs involved in selling and then buying again elsewhere like stamp duty and capital gains tax. They said that moving equity around by “trading” property would eat into profits.
That was when I was a noob. But I’ve learned a lot since those days. One of the biggest lessons I’ve learnt is that some experts are experts of marketing more so than experts of property investment.
Another thing I’ve learnt is that there are definitely cases for selling despite how costly it can be.
Definitely a case for selling
It usually comes down to the property’s potential for growth in the short-term.
“Sometimes it makes perfect financial sense to sell and invest your dollars elsewhere.”
It’s not a certainty that investors must sell every property at some time. It might never make financial sense to sell your property at any time in 30-years of ownership. Mind you, that would actually be a rare case. On the other hand, there are some occasions when the perfect time to sell a property, might be only 3 years after just buying it!
Market cycles
Every market cycle is different. Each cycle brings around a unique set of circumstances. Each property in each cycle needs to be examined on a case by case basis rather than blindly following broad generalisations that are poorly researched and fast becoming out-dated.
A black and white rule of “never sell” is too simplistic. Life is usually a lot more complicated. It would be great to have a simple rule like, “buy and never sell”. But simpleness on its own is not a good enough reason.
And unfortunately, my challenge of this hold-forever theory requires an understanding of 2 complicated concepts:
The case for selling requires an analysis of these two concepts.
Recycling cost
This is the cost of firstly selling your property to release funds, and secondly, putting those funds elsewhere, i.e. buying an alternative property. The recycling costs are broken down into two categories:
- Exit costs; and
- Re-entry costs
“Exit” costs are the costs to sell your property. They consist of:
- Capital gains tax
- Selling agent’s commission
- Legal fees
- Maybe clean-up costs or marketing too
After paying back the mortgage, you’re left with sale proceeds that can be re-invested elsewhere.
Using the sale proceeds to buy elsewhere comes with more costs. These are called “re-entry” costs. These consist of:
- Stamp duty
- Legal fees
- Inspection costs such as building, pest & strata
The combination of exit costs and re-entry costs total up to the recycling costs. These are the costs of changing your mind about which property your money is invested in.
Opportunity cost
Opportunity cost is the difference between what an alternative investment could earn you and what your current investment could earn you.
For example, if your current investment property earned you $100,000 in capital gain over the last 3 years and $100,000 in rental income over the same time-frame, you’ve earned $200,000. But you’re not better off by $200,000 because there are costs you’ve incurred along the way. What if it cost you $125,000 in mortgage interest and other expenses, then your net gain over those 3 years would have been only $75,000.
+ $100,000 capital gain
+ $100,000 rental income
– $125,000 expenses
= $75,000 wealth created
Now, if there was an alternative property that you could have owned over that time that had better capital growth, you would endure an “opportunity” cost.
For example, what if the alternative property had $150,000 in capital gain instead of only $100,000? Assume the same income and expenses.
+ $150,000 capital gain
+ $100,000 rental income
– $125,000 expenses
= $125,000 wealth created
Your property had net earnings of $75,000
The alternative had net earnings of $125,000
There’s a $50,000 difference.
Your property was short of the alternative property by $50,000 over those 3 years. So, your opportunity cost was $50,000.
It’s not a fee to be paid, it’s just a mental pain knowing you could have done better.
OK, so we have these two concepts: recycling costs and opportunity costs. These are used to determine whether we should sell or not.
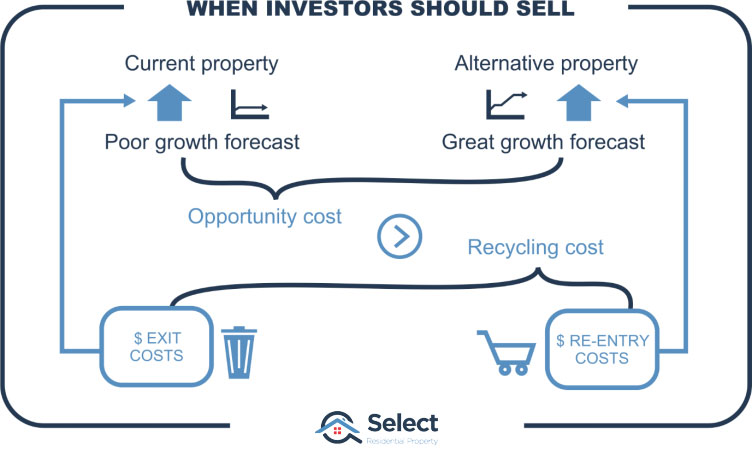
When should we sell?
The trigger to sell is when the forecast opportunity cost exceeds the estimated recycling costs.
IF OPPORTUNITY COSTS > RECYCLING COSTS THEN SELL & BUY ELSWHERE
This means it doesn’t cost as much to sell and buy again elsewhere compared to what you’re likely to miss out on. In other words, if you’re going to miss out on more than the cost to replace your investment, it’s worth the effort.
If, however, the forecast opportunity costs are less than the recycling costs…
IF OPPORTUNITY COSTS < RECYCLING COSTS THEN HOLD
…then it makes no sense to sell because what you’re going to miss out on is not as large as what you’re going to spend moving your equity around.
“The decision to sell is based on a simple comparison: Recycling costs vs. Opportunity costs”
If recycling costs exceeds opportunity costs, hold. But if opportunity costs exceed recycling costs, then sell.
The concept is simple enough, but coming up with accurate figures is the tricky part. It’s so tricky in fact, that it’s the major reason behind the advice you hear: “never sell”. Most property investment advisors simply can’t predict, with any reliable degree of confidence, the capital growth over the next few years. Without that confidence, all they can do is recommend a “hold”.
How long do I wait?
Now some might argue that if an investor just holds on, maybe they’d start to see some growth eventually. Yeah, I agree. But how long should an investor wait for a property to have some growth before calling it a mistake and salvaging what they can?
If a property is growing at 3% and is cash-flow neutral, it’s only just barely keeping up with inflation.
It’s not impossible for a property market to stay depressed for a decade. And in small regional markets, it could be multiple decades.
But even big city markets can stay flat for half a dozen years or more.
Sydney example
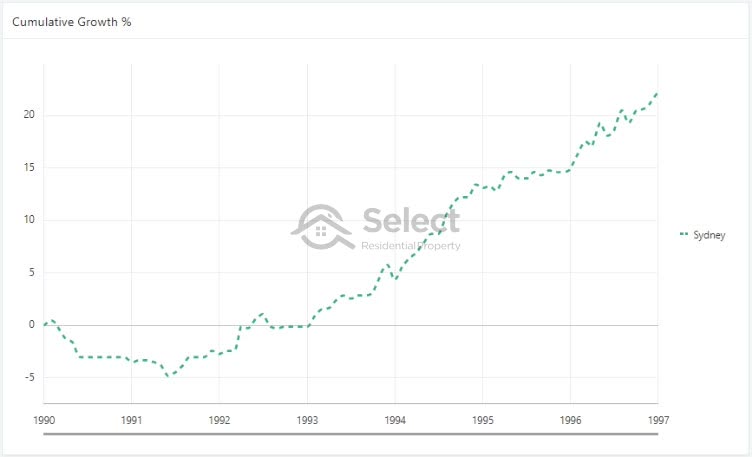
Sydney had less than 3% per annum growth for the 7 years from 1990 to 1997. The chart looks like there’s good growth, but it’s cumulative growth, not a growth rate. It took 7 years to sum up to only 20%. The growth rate was actually less than 3% per annum.
And it wasn’t a one-off for Sydney. There was an even bigger stretch of low single digit growth.
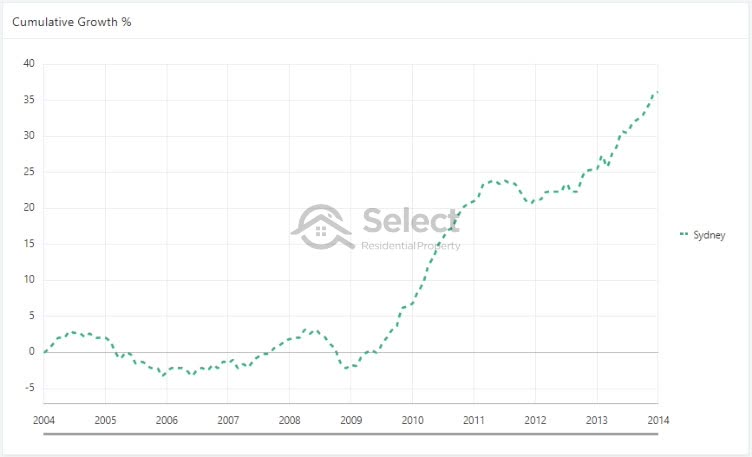
Here’s a stretch of 10 years of only 3% growth per annum. It started in 2004 and went to 2014.
But you can see in the chart a massive spike from 2009 to 2011 and another from about 2013. And this is crucial to the argument of why investors should sell. Markets don’t grow at a consistent rate. Instead, they have banging bursts followed by boring busts. I’ll elaborate on why that’s important later. But for now, some more examples.
Melbourne example
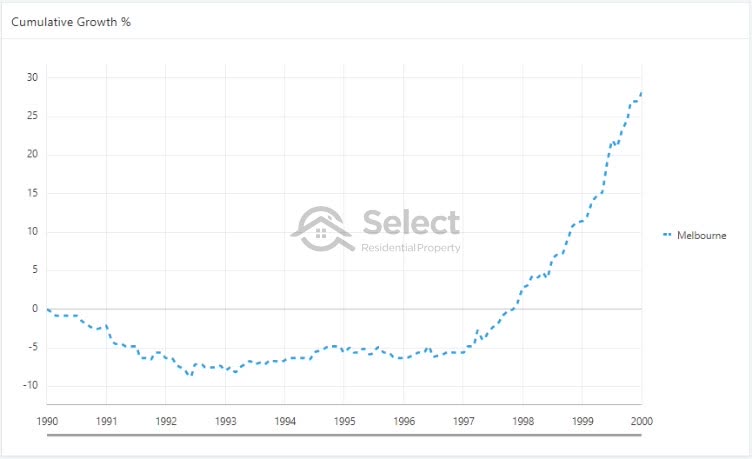
Melbourne had 3% growth per annum for the eleven years from 1989 to 2000.
We see the same thing again, a period of yawns followed by a period of yippie. And the yippie is short and sharp while the yawn, drags on.
Here’s Melbourne for the 5 years from 2011 to 2016.
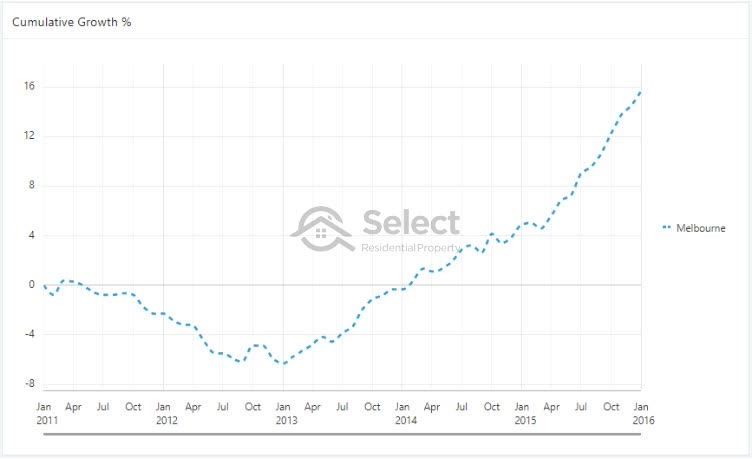
Despite how good this chart looks, especially in the 2nd half, the growth over this total time-frame was less than 3% per annum. Over 5 years, the growth totalled less than 16%.
And this is the same story for all these charts – very impressive growth for short periods, but over the total period shown on the chart, unable to keep pace with inflation.
Remember, if a property is growing at 3% and is cash-flow neutral, it’s barely keeping up with inflation. How long should an investor hold on?
Even as little as 3 or 4 years, is a long time to hold a negatively geared property that is barely keeping up with inflation. You’re basically going backwards with each passing year. And the longer it drags on, the less time you have left in your life to recover from that mistake.
Burying your head in the sand will help 3 years pass by relatively quickly. What won’t help, is hearing of other markets around the country stacking on double digit growth every one of those 3 years.
Are the reasons still there?
The 1st question everyone wants to know about a market dragging its feet, is whether it will start growing anytime soon?
Well, ask yourself this, why did you buy in that location in the first place? What were the reasons that attracted you to this location? Are those reasons still playing out?
Imagine you bought in a suburb because there was a business precinct being built and a new motorway was planned that would improve transport. Perhaps you thought those were really good drivers of future growth, so you bought a property there.
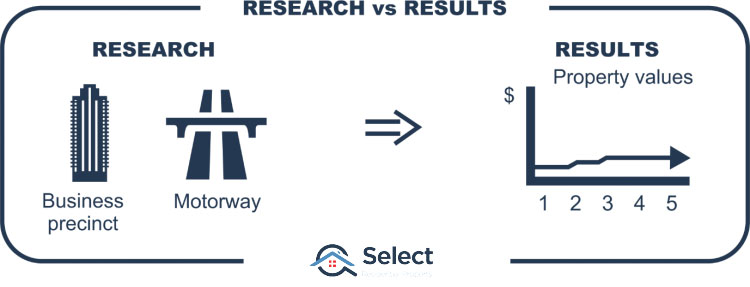
Now what if there simply wasn’t any growth. After 2, 3, 4 years, there’s been nothing. It just didn’t happen. Perhaps the motorway didn’t get the go ahead. Perhaps the business park was a lot smaller than you had imagined.
Whatever the reasons, the point is you were wrong. So, why hang on to that property? You’ve already discovered you got your research wrong. Is the business park going to be extended? Is the motorway going to be extended? Are the reasons for superior growth still yet to play out or did you just get it all wrong?
Mistakes
We all make mistakes. I’ve made plenty…
Probably my biggest mistake was not selling. It sounds ironic doesn’t it when most of the advice you hear is about holding for the long-term. The worst time of my life was when I was contemplating bankruptcy. I’m glad I toughed it out. It was a long hard road. It all could have been avoided if I had sold.
Mistakes are the best learning experiences if we respond to them appropriately. Denial is not an appropriate response.
“It takes courage & humility to put your hand up, admit you made a mistake”
But once you do, you can take that learning into your research for the next purchase. The quicker you can admit you stuffed up, the quicker you can learn from it and the sooner you’re going to start making profitable investments.
If you hang on thinking it was a long-term investment anyway, how long do you have to wait to admit you were wrong, 5 years, 10, 15 years of humbling growth? And then after the bad years, how many years of above average growth in the future does this location need, to overcome all those years of below average growth?
Is it that bad selling?
Is it really that bad selling? Let’s say you were to sell. How much would you lose? What are the costs? Let’s go through an example.
The agent you enlist to sell your property is going to take about 2% as a commission. For a $500,000 property that’s around 10,000 dollars. There are legal fees of around $1,000 and maybe clean-up costs too of say $500.
Selling expenses example
2% COMMISSION $10,000
LEGALS $1,000
CLEAN-UP $500
CGT $20,000
GAIN $100,000 APPLY DISCOUNT 50% = $50K
MARGINAL TAX RATE OF SAY 40% = $20K
——————————————
31,500
One good thing about having no growth is you won’t be liable for capital gains tax. CGT is by far and away the biggest expense to selling – if you got your research right.
Note that some entry and exit costs like stamp duty and the agent’s commission can be deducted from the capital gain.
In this example, the total exit costs (that’s the cost to exit the property market) were over 6% of the property’s value.
How much money would this investor have after the sale? Let’s break it down.
Assume they bought the property for $400,000 about 5 years ago.
And assume they had an 80% loan-to-value ratio.
LVR 80% therefore mortgage of $400,000 x 80% = $320,000
After 5 years of measly growth, the property’s price might be only $500,000
If they sold the property for $500k and paid back the mortgage of $320k and paid the exit costs of $31,500 they’d have $148,500 in the bank. These are called the post-tax sale proceeds because CGT has been paid after the sale. This is money that can now be allocated to an alternative investment.
If there was no CGT to pay, the exit costs would have only been around 2% rather than 6%.
Entry costs
Now, those were just the costs for selling. What about the costs for buying, or re-entering the market? This will set you back about another 5% of the price of the property in stamp duty, legal fees, inspections, etc.
Purchase price = $580,000
Stamp duty of $25,000
Legal fees of $1,250
Inspections of $750
5% is a rough guide. The major expense is another tax – stamp duty. And that depends on which state you buy in and what price you pay for the replacement property.
So, in total, assuming you don’t have capital gains tax to pay, moving your deposit funds out of one property and into another will knock you back about 7% of the value of the property. A $500k property will cost you $35k to move your equity out of one property and into another.
But in our example, there is a CGT liability to pay of $20,000.
Recycling costs
$31,500 exit costs as shown before
+
entry costs of $27,000 as shown before
=
$58,500 or around 12% of property’s value
So, in this case, the total cost of recycling your equity was $58,500. That equates to about 12% of the property’s current value. That’s significant. But it’s not the end of the world. It might not be that hard to find a replacement property ready to outperform your current dud by 20% over the next few years.
Property A: $500k with 10% growth over 4 years or $50,000
Vs. property B: $500k with 30% growth over 4 years or $150,000
Difference is 20% or $100,000
A 20% difference in growth for a $500k investment is $100k. That certainly makes up for the ~$60k you’ve lost recycling your equity. You’d be better off by over $40,000.
It all comes down to growth
So, even after considering all the exit costs, including CGT and all the entry costs, you’d still be better off in this case by $40,000.
And the reason why is because of the difference in capital growth between your current property and the alternative over the next few years. If the difference was only minor, the recycling costs would outweigh the opportunity cost.
What if the growth difference was only 10%?
Property A: $500k with 15% growth over 4 years or $75,000
Vs. property B: $500k with 25% growth over 4 years or $125,000
Difference is 10% or $50,000
That is, the growth over the next few years for your existing property was better than expected, it totalled 15% instead of 10%. And the growth for the alternative investment wasn’t as flash as first thought, totalling only 25% instead of 30%.
Now the difference is only $50,000. After taking off the $58,500 in recycling costs, you’d actually be worse off by $8,500.
It all comes down to the difference in growth between your current property and the alternative over the next few years. How likely is that difference going to be significant, like 20% or more? And how long will it take for a supposedly superior property to claw back all those recycling costs and start showing a profit?
Well, remember, I said that one of the key arguments for trading properties as opposed to holding them long-term, is that growth happens in short thrusts followed by long busts. It’s almost never consistent steady growth. It’s far more common to see either rapid growth or virtually nothing. Consistent, steady growth is actually quite rare and short-lived. Let me show you some examples.
Perth vs Sydney example
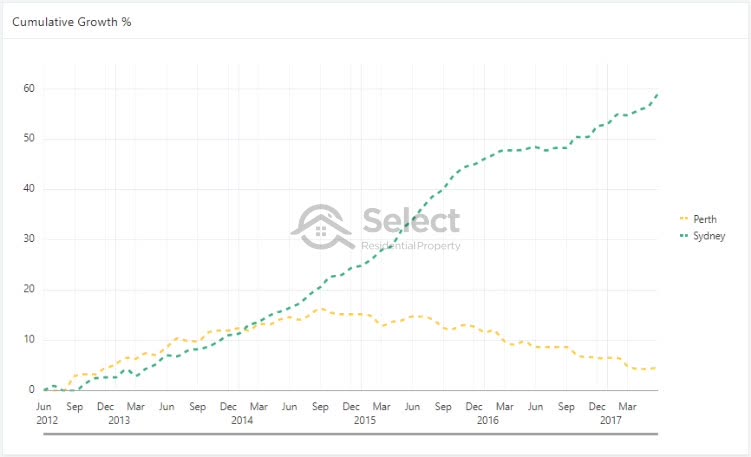
Imagine it’s the middle of 2012 and you’re looking where to invest and you choose Perth instead of Sydney.
At first it might have seemed to be a good pick with roughly 7% growth per annum for the first couple of years. But over the entire 5 years from 2012 to 2017, the difference between these two cities was a staggering 55%.
The opportunity cost of making the wrong decision in this case was quarter of a million dollars over only 5 years. This is not just a few properties in Perth versus a few in Sydney, this is the average for all properties in both cities. This is not a comparison of a city and a risky regional market. Perth is the 4th largest significant urban area in Australia.
Perth CGT
What if an investor had bought in Perth a long time ago and had to pay significant capital gains tax? Surely in this case the capital gains tax would be so large that the selling costs would make recycling equity too costly.
Well, let’s assume the capital gain was equal to the entire value of the property. In other words, assume the investor bought their Perth property for zero dollars.
Perth median $460,000
Show capital gain of $460,000
Show 50% CGT discount applicable = $230,000
The median value for Perth back in mid-2012 was $460,000. The investor would have a 50% CGT discount which halves the capital gain to only $230,000. There would be entry and exit costs the investor could claim to reduce that capital gain, the “cost base”, but let’s even ignore those to make the case even more extreme.
Show marginal tax rate of 45% = CGT payable of $103,500
Agent’s commission at 2% = $9,200
Legal fees $1,000
Total exit costs of $113,700
At the highest marginal tax rate in Australia of 45%, the total CGT payable would have been around $100,000. Add to this the agent’s commission and legal fees, the total exit costs would have come to $113k. That’s enormous and we haven’t even considered re-entry costs.
Entry costs of about 5% of $575k = $28,750
Total recycling costs of $142,450
Was Sydney worth it?
The Sydney median in mid-2012 was around $575k. Entry costs at 5% of a $575,000 property would total over $28k. So, the total cost to recycle your equity with the highest imaginable capital gains tax liability would have been about $142k. Ouch! Surely with such massive recycling costs, there’s no option but to hold.
Well, the opportunity cost was over quarter of a million dollars.
4.6% growth in Perth median of $460k = $21,160
Show 59.1% growth in Sydney median of $575k = $340,000
Opportunity cost = $318,840
Better off after 5 years by $176,390 if an investor recycled equity
The Perth median rose 4.6% while Sydney rose nearly 60%. For their relative price ranges, the opportunity cost was over $300,000. Even after considering the highest possible recycling costs for a typical Perth investor, they still would have been better off by $176k after only 5 years.
The difference was so significant, that it’s unlikely any one of the 200,000 Perth investors wouldn’t have been better off selling up out of Perth and putting their money into Sydney. Those 200,000 investors represent about 7% of all property investors country-wide.
In other words, this is not just one extreme case, there were 200,000 investors in this circumstance.
Brisbane vs Sydney example
Let’s have a look at Brisbane around the same time.
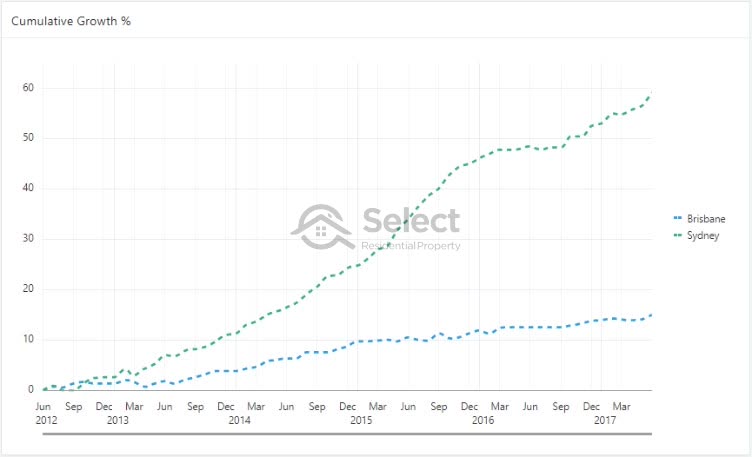
The difference in growth was not as severe in this comparison, only 44%. But it was still significant enough to give the vast majority of Brisbane property investors very little reason to hold onto a property in Brisbane instead of recycling their equity to Sydney instead.
There were about 350,000 property investors in Brisbane at the time. That represents about 12% of all Australian property investors. Investors in Darwin and Adelaide would have drawn the same conclusion – sell.
We’re talking about more than 20% or 1 in 5 property investors should have sold. But that’s if they had known about the growth prospects of their current property market and the alternative.
And this is looking at one stretch of 5 years in Australian property growth. This was not an isolated case. There have been plenty of historical cases where one city is booming and another is stagnant.
Melbourne or Perth vs Brisbane example
Here’s a difference of over 40% between Melbourne at the bottom and Perth & Brisbane at the top.
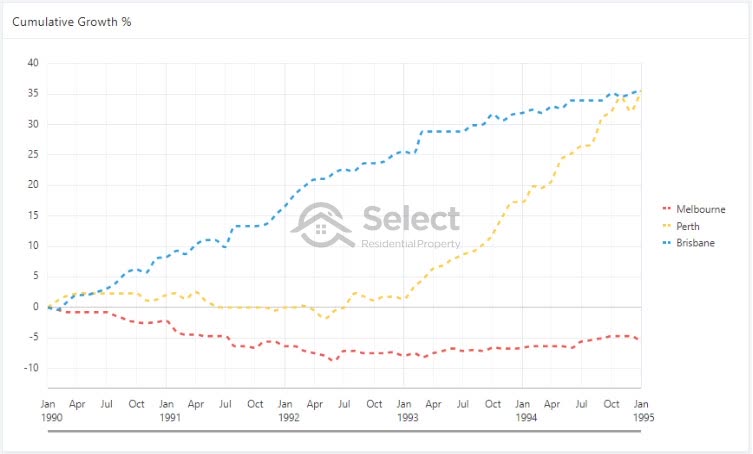
This was from 1990 to 1995. Melbourne went backwards over this time-frame. It was only about 1% per annum over 5 years. But while Melbourne investors were holding on to low yielding negatively geared properties, investors in Perth and Brisbane were giggling.
Hobart & Adelaide vs Darwin
Here’s another 5-year period. It’s from 2000 to 2005 we can see…
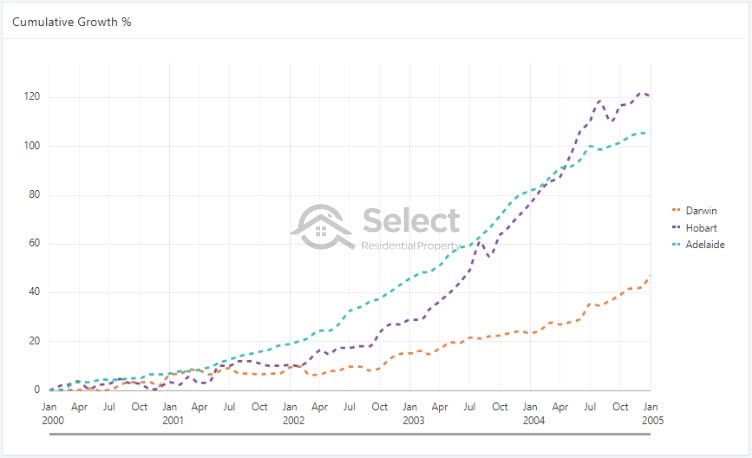
…a difference in growth of over 40% for the top markets of Hobart and Adelaide versus Darwin at the bottom. Again, in this case there are an enormous number of investors who should’ve moved their money. The opportunity cost was simply too high for any recycling costs to have come close.
Perth’s turn
Here’s a 70% growth difference over 5 years between Perth and Sydney.
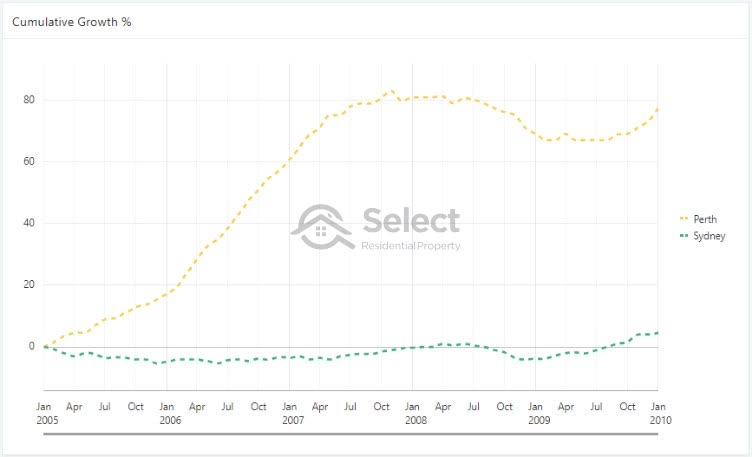
This was from 2005 to 2010. In this case it was Perth on top and Sydney on the bottom. A few years later the roles completely reversed. This highlights how important it is to time entry into the market and how unimportant the location is. BTW, for more details on that, check out another topic in this series titled:
“It’s all about location – WRONG!” Actually, it’s about timing.
Perspective
Try to find a point any time in the last 25 years where there wasn’t a 5-year period where one state capital wasn’t outperforming another over that 5-year period by more than 30%. Every city has its time to shine.
But opportunity costs aren’t just calculated by comparing state capital cities. There are loads of significantly sized regional markets with tremendously diversified economies and large populations. Throw these markets into the mix and the difference between a flat and a booming market is even more pronounced.
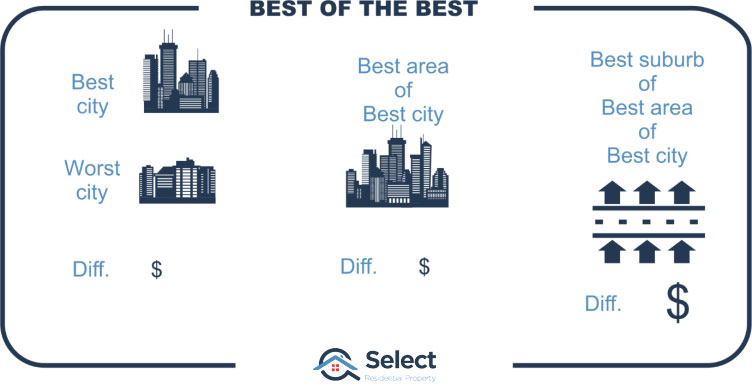
And within each state capital city or regional market there are certain suburbs that will outperform the average for that area. If you calculate opportunity costs by comparing suburb growth rather than city growth and you look across all of Australia, you’ll see some absolutely amazing contrasts over the years.
Given these tremendous differences in capital growth, the opportunity costs are simply too high to ignore. And these cases are quite common place.
“The vast majority of investors should be looking for opportunities to recycle their equity on a regular basis”
With all these cases, you’d think the experts would be encouraging a recycling of equity. But one problem they have, is simply not knowing what’s going to happen, at least not with any reasonable degree of accuracy. If you don’t know, you’re simply safer hanging on.
Risky
Without knowing how any market is going to perform in the short-term, you’re taking a risk selling the property you’ve got and buying an alternative elsewhere. The “elsewhere” property may underperform.
On the other hand, there are risks to sticking your head in the sand and dogmatically believing that sooner or later your market will come good. You don’t know how long it will take to recover.
My mistakes
I’ve held onto property in declining markets in the past and lost a lot of money.
“I’ve learnt to never take my eye off the markets I’m exposed to”
I don’t perform fresh exhaustive research on each market every month. But I do look up a few key metrics.
It only takes me 5 minutes once a month to examine the demand to supply ratio for each market I own a property in. If the market starts to deteriorate, the demand to supply should start to drop to worrying levels. That’s my trigger to research that market a little more closely.
By keeping my eye on the key indicators, I’m aware of any changes. I can easily pop my property on the market if I find out things have turned poorly.
Why they say never sell
Anyway, the major reason why so many experts have advised to never sell, is because they’re unable to forecast capital growth with any reasonable degree of accuracy or reliability. They can’t forecast where prices will be in a few years for your current property; and they can’t find a better alternative with any degree of confidence that it will outperform. So, it makes perfect sense to advise their clients to hold.
If the markets they’ve picked to have good short-term growth fail to deliver, they fall back on the old excuse, “But it’s a long-term investment”.
“The long-term excuse covers a multitude of ineptitude”
Conclusion
So, in conclusion, there are definitely times you should sell your investment property.
It’s when opportunity cost exceeds recycling cost. And you can see from all the historical evidence, that it’s not a rare circumstance for an investor to find themselves in.
What’s more, it’s not that hard now days to figure out which way markets are going. There are some pretty good indicative metrics out there to help you make that decision.
But, if you don’t have the expertise, holding on blindly may not be a bad option. More so if you have patience and can keep the blinkers on.
Personally though, I’m never going to take my eyes off markets I’m exposed to. And hopefully as I age, I’d like to think I can stay open minded to new technology that is changing our approach to property investing.