Introduction
There’s a popular urban myth among property investors that a 3% vacancy rate is the sign of a balanced market. The data suggests something quite different.
How I calculate vacancy
Firstly, I should clarify how to calculate the vacancy rate. Step 1 is to get a count of all the properties listed for rent, i.e. a count of vacancies. But some properties may mention they’re not available for rent until some future date. Those are excluded since technically they’re not vacant yet.
The number of “landlord-owned” properties in the market is then divided by the count of vacancies. That figure is then converted to a percentage. Note that not every property in a suburb is landlord owned.
Insight 1 – current average
The average vacancy rate Australia wide was 1.75% at the end of December 2018 which is when I decided to look into this. And the median was only 1.44%.
More can be seen on this statistic from the following info-graphic:
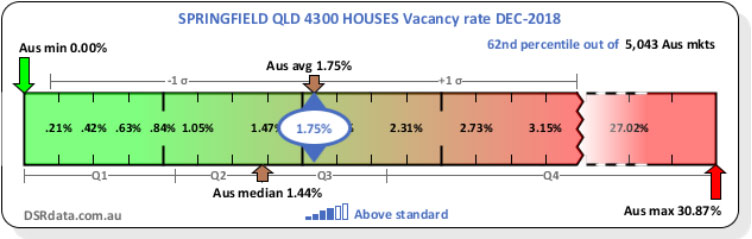
This is what I call a context ruler. It places a statistic in context by comparing it to property markets from around the country. It’s a bit to take in, but it’s easy to understand once explained.
The title shows that this is the vacancy rate context ruler for Springfield houses in QLD as things were back in December 2018. In the top right you can see there were over 5,000 suburbs around Australia that had a measurable vacancy rate for houses in December 2018.
In the top left you can see the minimum vacancy rate country-wide was zero. Bottom right shows the maximum was over 30%.
In the middle top of the ruler you can see the average at 1.75%. And underneath the ruler you can see the range of vacancies that make up the 4 quartiles.
The median vacancy rate is the middle property market when all are placed in order. You can see the median at the bottom of the chart at 1.44%. The median lies between the 2nd and 3rd quartiles.
From this infographic you can see that most property markets had a vacancy rate well under 3%. In fact, 75% had a vacancy rate less than about 2.25%. So, straight away we can say this was either a peculiar time of tight vacancy rates country-wide or 3% is not a good standard.
Insight 2 – historical average
Past years show that the average vacancy rate has been pretty consistent.
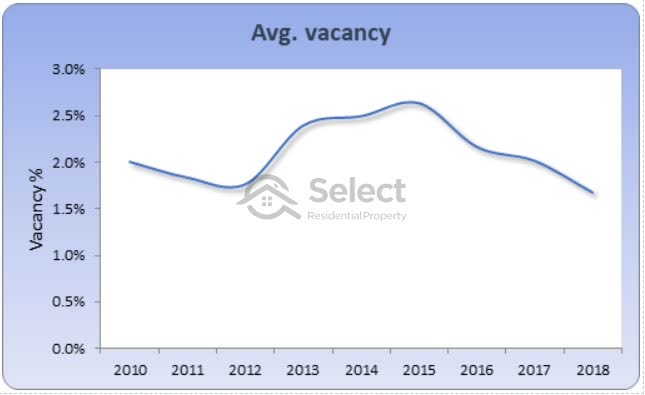
This chart shows the change in the national vacancy rate since January 2010. Yes, the 2018 vacancy rate is quite low compared to historical averages. But it has been this low before – back in 2012. And it’s never really got close to 3% for any time in the last 10 years.
Since the average over this time has been a little over 2%, so far, it’s looking like 2% should be the benchmark rather than 3%.
Insight 3 – houses vs units
The long-term average didn’t differ much between houses and units:
- Houses 2.19%
- Units 2.27%
You can see that the long-term average vacancy rate has been closer to 2% than to 3%.
Insight 4 – state vs. state
Different states have different real estate laws and may have different habits regarding listing properties for rent, so what about a break-down by state?
- ACT 1.4
- NSW 2.15
- NT 1.64
- QLD 2.52
- SA 1.9
- TAS 2.37
- VIC 2.28
- WA 2.07
Long-term there is some significant difference in each state’s vacancy rate. However, those figures for ACT and NT should be swallowed with a grain of salt. They’re very small markets so the figures could be a little less reliable than the larger states like NSW, VIC and QLD. The most populous states all have long-term averages around the low to mid 2% range.
Note that there wasn’t a single state with a long-term average vacancy rate of 3%.
Insight 5 – capital cities
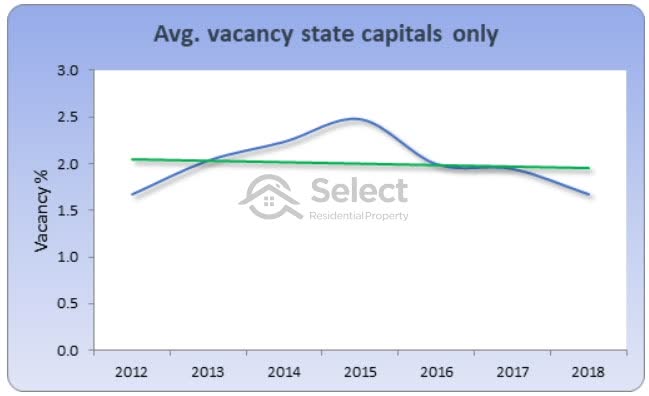
What if we eliminate all those weird markets in regional locations and focus on state capitals only?
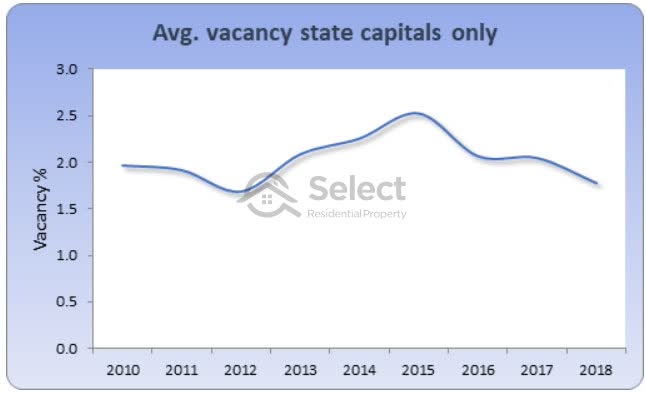
There’s very little difference and the average still looks like around 2%. Let me just run a line of best fit through that curve to show you.
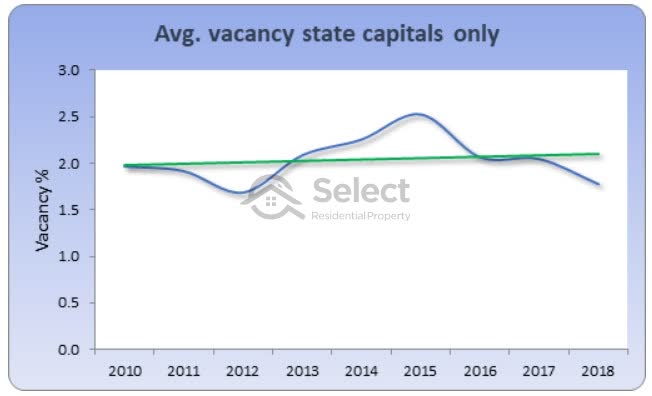
Now you can see that the average vacancy rate is much closer to 2% than 3% most of the time.
Insight 6 – reliability
Sometimes the vacancy rate can get a little unreliable especially in small or thinly traded markets. Let’s eliminate all but the most reliable property market figures for vacancy. I removed suburbs from consideration if the volume of rentals was too low to be reliable.
The average vacancy rate didn’t change much. And it’s closer to 2% than ever.
Insight 7 – rent growth
Perhaps this is an over-simplistic way of looking at what constitutes a “balanced” market. Our markets might have been unbalanced for a long time. How else can we judge whether a market is balanced or not?
One thing I’ve noticed is that if vacancy rates are really low, there is pressure on tenants to get into properties. The property managers are aware of this and may mention a rental increase is possible to their landlords. As a result, the yields in the area start rising – especially if property prices are static.
So, why don’t we examine cases where low vacancy rates start causing rents to rise? Rents will rise anyway though due to inflation. So, we need to assume that rental growth above 2.5% is a market in which vacancy rates are tight and therefore out of balance.
We can also assume that if rents are not growing by at least the rate of inflation, then vacancy rates are too high. The balance point will be where rents are growing at the same rate of inflation.
Vacancy rates vs rent growth
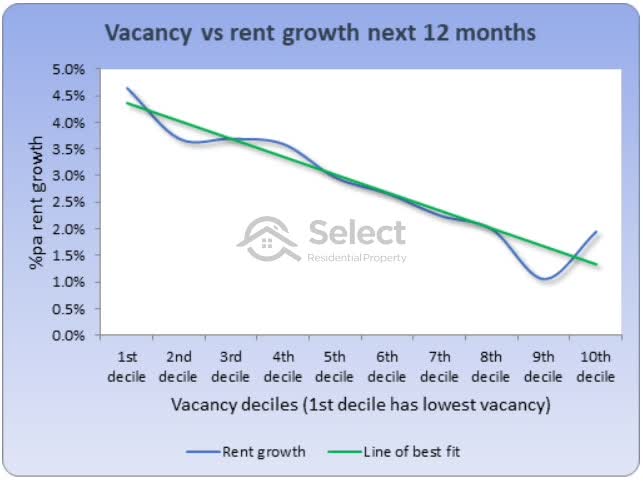
This chart shows the relationship between vacancy rates and the following 12 months of rent growth. I’ve split the vacancy rates into deciles. Each decile is a group containing 10% of all property markets. But the group each 10% fit in is determined by their vacancy rate.
The 1st decile to the left of the chart contains all markets that had a vacancy rate in the lowest 10% of all vacancy rates. The highest decile to the right is the nasty end with the highest vacancy rates in the country.
The first thing you notice is how high vacancy rates diminish your chances of getting any rental growth. And low vacancy rates increase the chance of rental growth. Nothing tremendously insightful there.
The green line is the line of best fit. It shows the relationship between vacancy rate and the following 12 months of rent growth is pretty close.
You can see that the green line passes through 2.5% rent growth at about the 7th decile. This means that rent is growing in line with inflation around the 7th decile. The 7th decile therefore represents a vacancy rate in balance.
The vacancy rate at the middle of the 7th decile is around 2%. It actually works out to be 1.98%.
Conclusion
There you have it, enough data insights to suggest that the true benchmark of a balanced vacancy rate should be 2%, not 3%. Property investors should be aiming at buying in markets where the vacancy rate is at most 2% and preferably as low as possible.