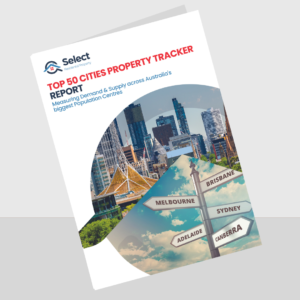
Our Top 50 Cities Property Report – measures and scores the demand vs. supply across our 50 biggest cities in Australia, by population size.
This monthly publication will assist its reader in understanding changing property trends in the property markets that count.
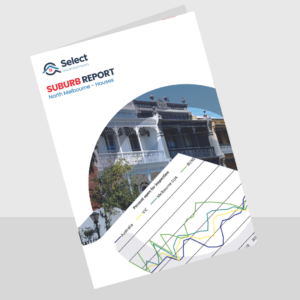
Where you put your property dollars, matters.
Not all suburbs are created equally. Even suburbs that are close to each other can have significantly different profiles. From the composition of property stock, to the differences in the people who live there.
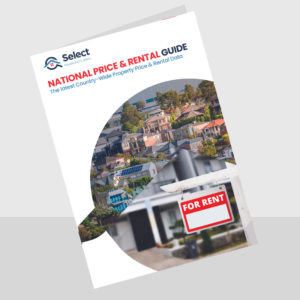
We know what its like trying to find this data, that isn’t 3 or more months old and missing countless suburbs of interest. Well, the search is over. Finally, a report that offers all the price and rental data for the Australia market in one report.
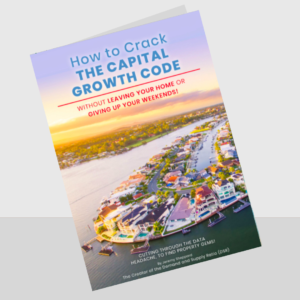
Jeremy Sheppard, the creator of the Demand to Supply Ratio, has put together a blueprint research approach that cuts through the data headache to show how you can find property gems.
As a data driven researcher, Jeremy is considered one of the best minds in identifying capital growth markets within Australia.
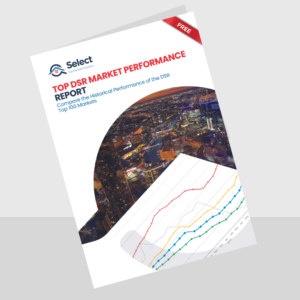
This report contains a list of the top 100 property markets as they were scored back in their day by the Demand to Supply Ratio (DSR+) of that time.
The idea of the report is to be transparent about the algorithm’s past performance. You can examine the performance of these suburbs independently, but we’ve put in the calculations if you don’t have the time.
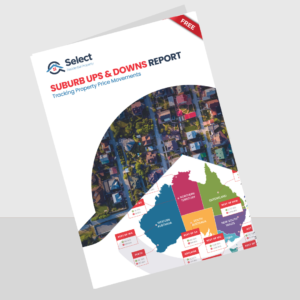
We’ve all heard the saying that there is no such thing as ‘the Australian Property Market’, that’s because there are literally hundreds, maybe even thousands of markets that make up the overall Australian property market.
That’s why we thought we’d have a bit of fun and create a snapshot report each month that shares the count of suburbs going up in value and the count of suburbs going down.
© Select Residential Property. All rights reserved.
Privacy Policy | Website Terms of Use