
| Property Type | Last Month | Last 3 Months | Last 6 Months | Last 12 Months | ||||||||||
|---|---|---|---|---|---|---|---|---|---|---|---|---|---|---|
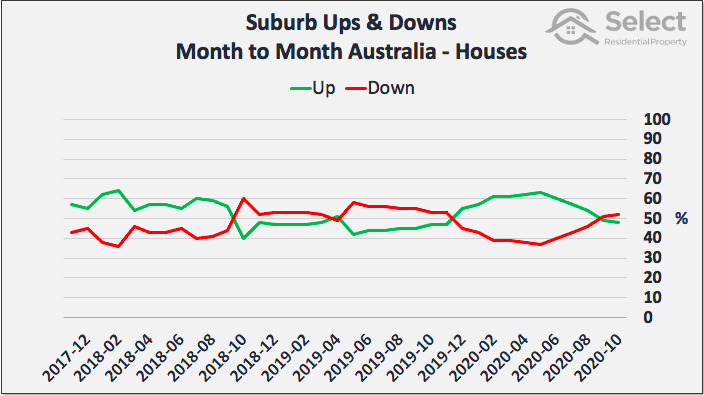
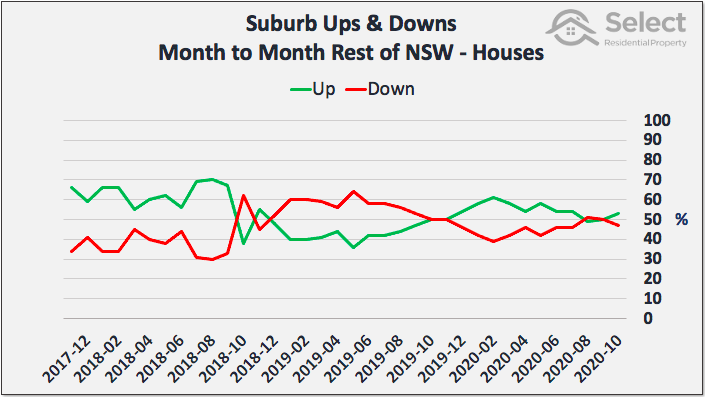
| Houses | 6720 | 53% | 6584 | 52% | 7542 | 60% | 8893 | 71% | ||||||
| 5925 | 47% | 6055 | 48% | 5005 | 40% | 3612 | 29% | |||||||
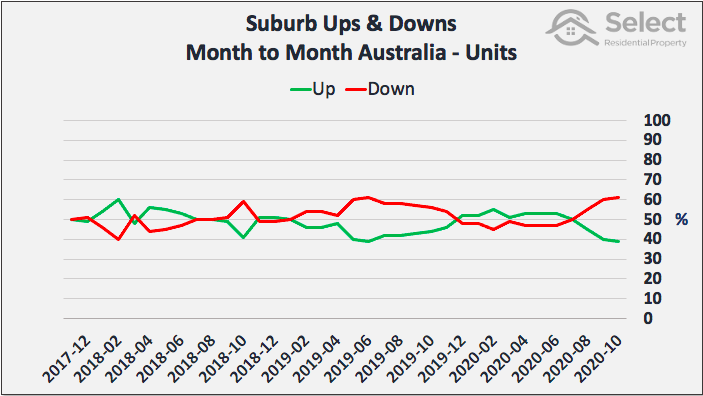
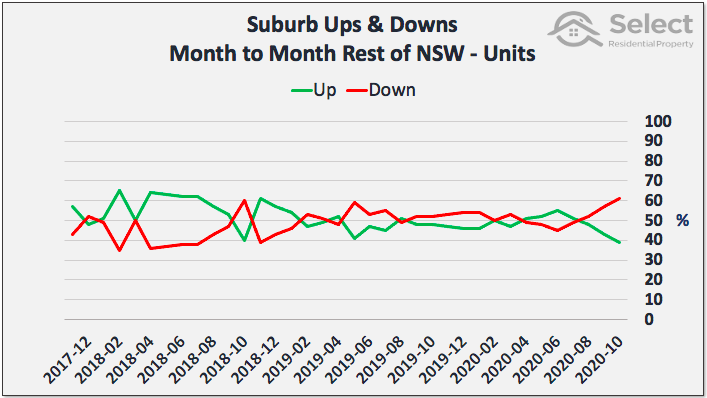
| Units | 2598 | 40% | 2634 | 40% | 3076 | 51% | 3692 | 62% | ||||||
| 3926 | 60% | 3877 | 60% | 2913 | 49% | 2266 | 38% | |||||||
| Both | 9318 | 49% | 9218 | 48% | 10618 | 57% | 12585 | 68% | ||||||
| 9851 | 51% | 9932 | 52% | 7918 | 43% | 5878 | 32% | |||||||
| Property Type | Last Month | Last 3 Months | Last 6 Months | Last 12 Months | ||||||||||
|---|---|---|---|---|---|---|---|---|---|---|---|---|---|---|
| Houses | 327 | 47% | 320 | 46% | 476 | 69% | 632 | 91% | ||||||
| 364 | 53% | 371 | 54% | 215 | 31% | 59 | 9% | |||||||
| Units | 269 | 40% | 274 | 41% | 400 | 61% | 549 | 83% | ||||||
| 399 | 60% | 394 | 59% | 260 | 39% | 110 | 17% | |||||||
| Both | 596 | 44% | 594 | 44% | 876 | 65% | 1181 | 87% | ||||||
| 763 | 56% | 765 | 56% | 475 | 35% | 169 | 13% | |||||||
| Property Type | Last Month | Last 3 Months | Last 6 Months | Last 12 Months | ||||||||||
|---|---|---|---|---|---|---|---|---|---|---|---|---|---|---|
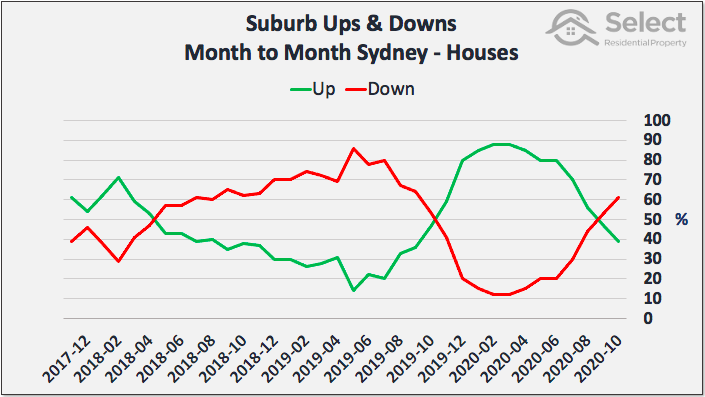
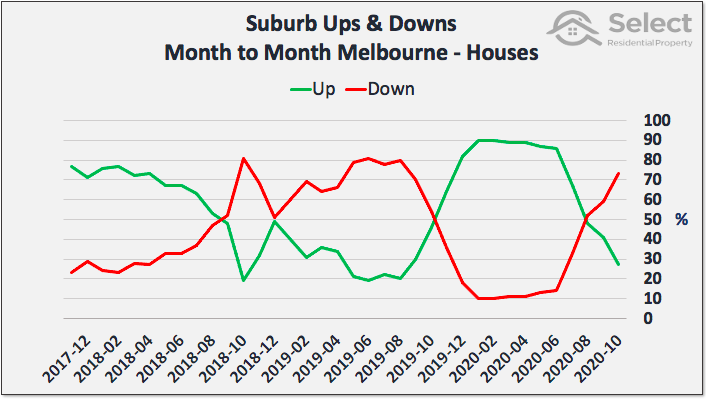
| Houses | 1954 | 59% | 1893 | 57% | 1931 | 59% | 2221 | 67% | ||||||
| 1353 | 41% | 1411 | 43% | 1368 | 41% | 1071 | 33% | |||||||
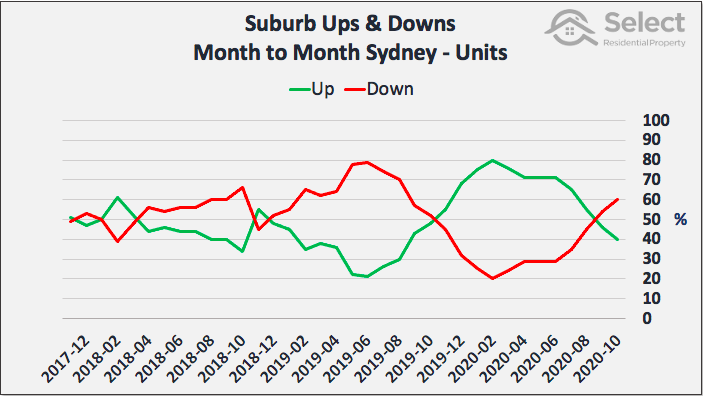
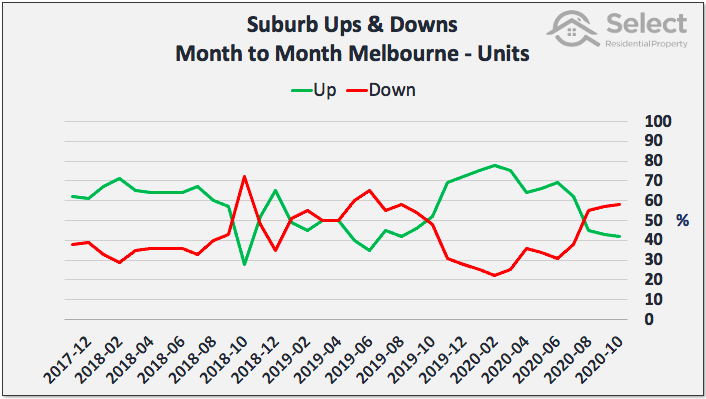
| Units | 577 | 43% | 589 | 45% | 658 | 55% | 711 | 60% | ||||||
| 751 | 57% | 733 | 55% | 533 | 45% | 476 | 40% | |||||||
| Both | 2531 | 55% | 2482 | 54% | 2589 | 58% | 2932 | 65% | ||||||
| 2104 | 45% | 2144 | 46% | 1901 | 42% | 1547 | 35% | |||||||
| Property Type | Last Month | Last 3 Months | Last 6 Months | Last 12 Months | ||||||||||
|---|---|---|---|---|---|---|---|---|---|---|---|---|---|---|
| Houses | 133 | 30% | 139 | 31% | 277 | 62% | 421 | 95% | ||||||
| 311 | 70% | 305 | 69% | 167 | 38% | 21 | 5% | |||||||
| Units | 169 | 39% | 176 | 41% | 239 | 57% | 340 | 80% | ||||||
| 261 | 61% | 254 | 59% | 184 | 43% | 83 | 20% | |||||||
| Both | 302 | 35% | 315 | 36% | 516 | 60% | 761 | 88% | ||||||
| 572 | 65% | 559 | 64% | 351 | 40% | 104 | 12% | |||||||
| Property Type | Last Month | Last 3 Months | Last 6 Months | Last 12 Months | ||||||||||
|---|---|---|---|---|---|---|---|---|---|---|---|---|---|---|
| Houses | 133 | 50% | 1086 | 53% | 1291 | 63% | 1523 | 75% | ||||||
| 1023 | ||||||||||||||